Current dynamics
The AUD / USD pair is still subjected to selling pressures, as it witnessed a strong decline in the beginning of today's trading.The decline came to continue the Australian dollar losing its gains last week, which came after the Reserve Bank of Australia announced an interest rate hike.
In addition to the weak investor appetite for risk, some may attribute the main reason for the increase in the demand for the dollar to the optimistic view by investors that the US Federal Reserve will stick to its tightening policy, raising interest rates at a faster pace to combat high inflation following the statements of the Fed members.US Federal Reserve member Thomas Barkin said that the Fed should raise interest rates as quickly as possible without breaking anything. We expect that message to be delivered again today when Powell delivers his semi-annual testimony before the Senate.
Also Christopher Waller, a member of the US Federal Reserve, added that he supports another increase in interest rates by 75 basis points at the central bank meeting in July if economic data emerges as he expects.
On the other hand, the US dollar index rose 0.4% at 104.83, coinciding with a limited decline in the yield on US Treasuries, which are trading near their highest levels in 11 years, as the yield on 10-year Treasuries reached 3.23%, and US home sales fell increased by 3.4% to 5.41 million in May 2022, the lowest level since June 2020.
Looking ahead and the scarcity of economic data on the Australian side, market investors' eyes will now turn to Fed Chairman Jerome Powell's semi-annual testimony before the Senate Banking Committee, scheduled for later during the North American session, in addition to his testimony on Thursday before the Joint Economic Committee in Washington.
Support and resistance levels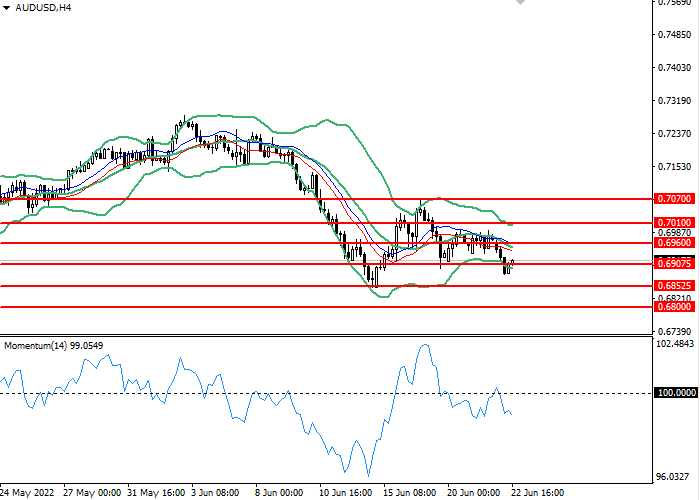
On the 4 hour chart, the instrument is holding onto the moving downside of the Bollinger Bands. The indicator is directed downward and the price range has widened, indicating that the current trend is about to continue. The momentum chart is below the 100 level, which is giving buy signals. The Envelopes indicator gives clear sell signals.
- Support levels: 0.69075, 0.68525, 0.68000.
- Resistance levels:0.69600, 0.70100, 0.70700.
Trading scenarios
- Short positions should be opened at the 0.69075 with a target of 0.68525 and a stop loss at 0.69600. Implementation period: 1-3 days.
- Long positions can be opened at the level of 0.69600 with a target of 0.70100 and a stop-loss at the level of 0.69100. Implementation period: 1-3 days.