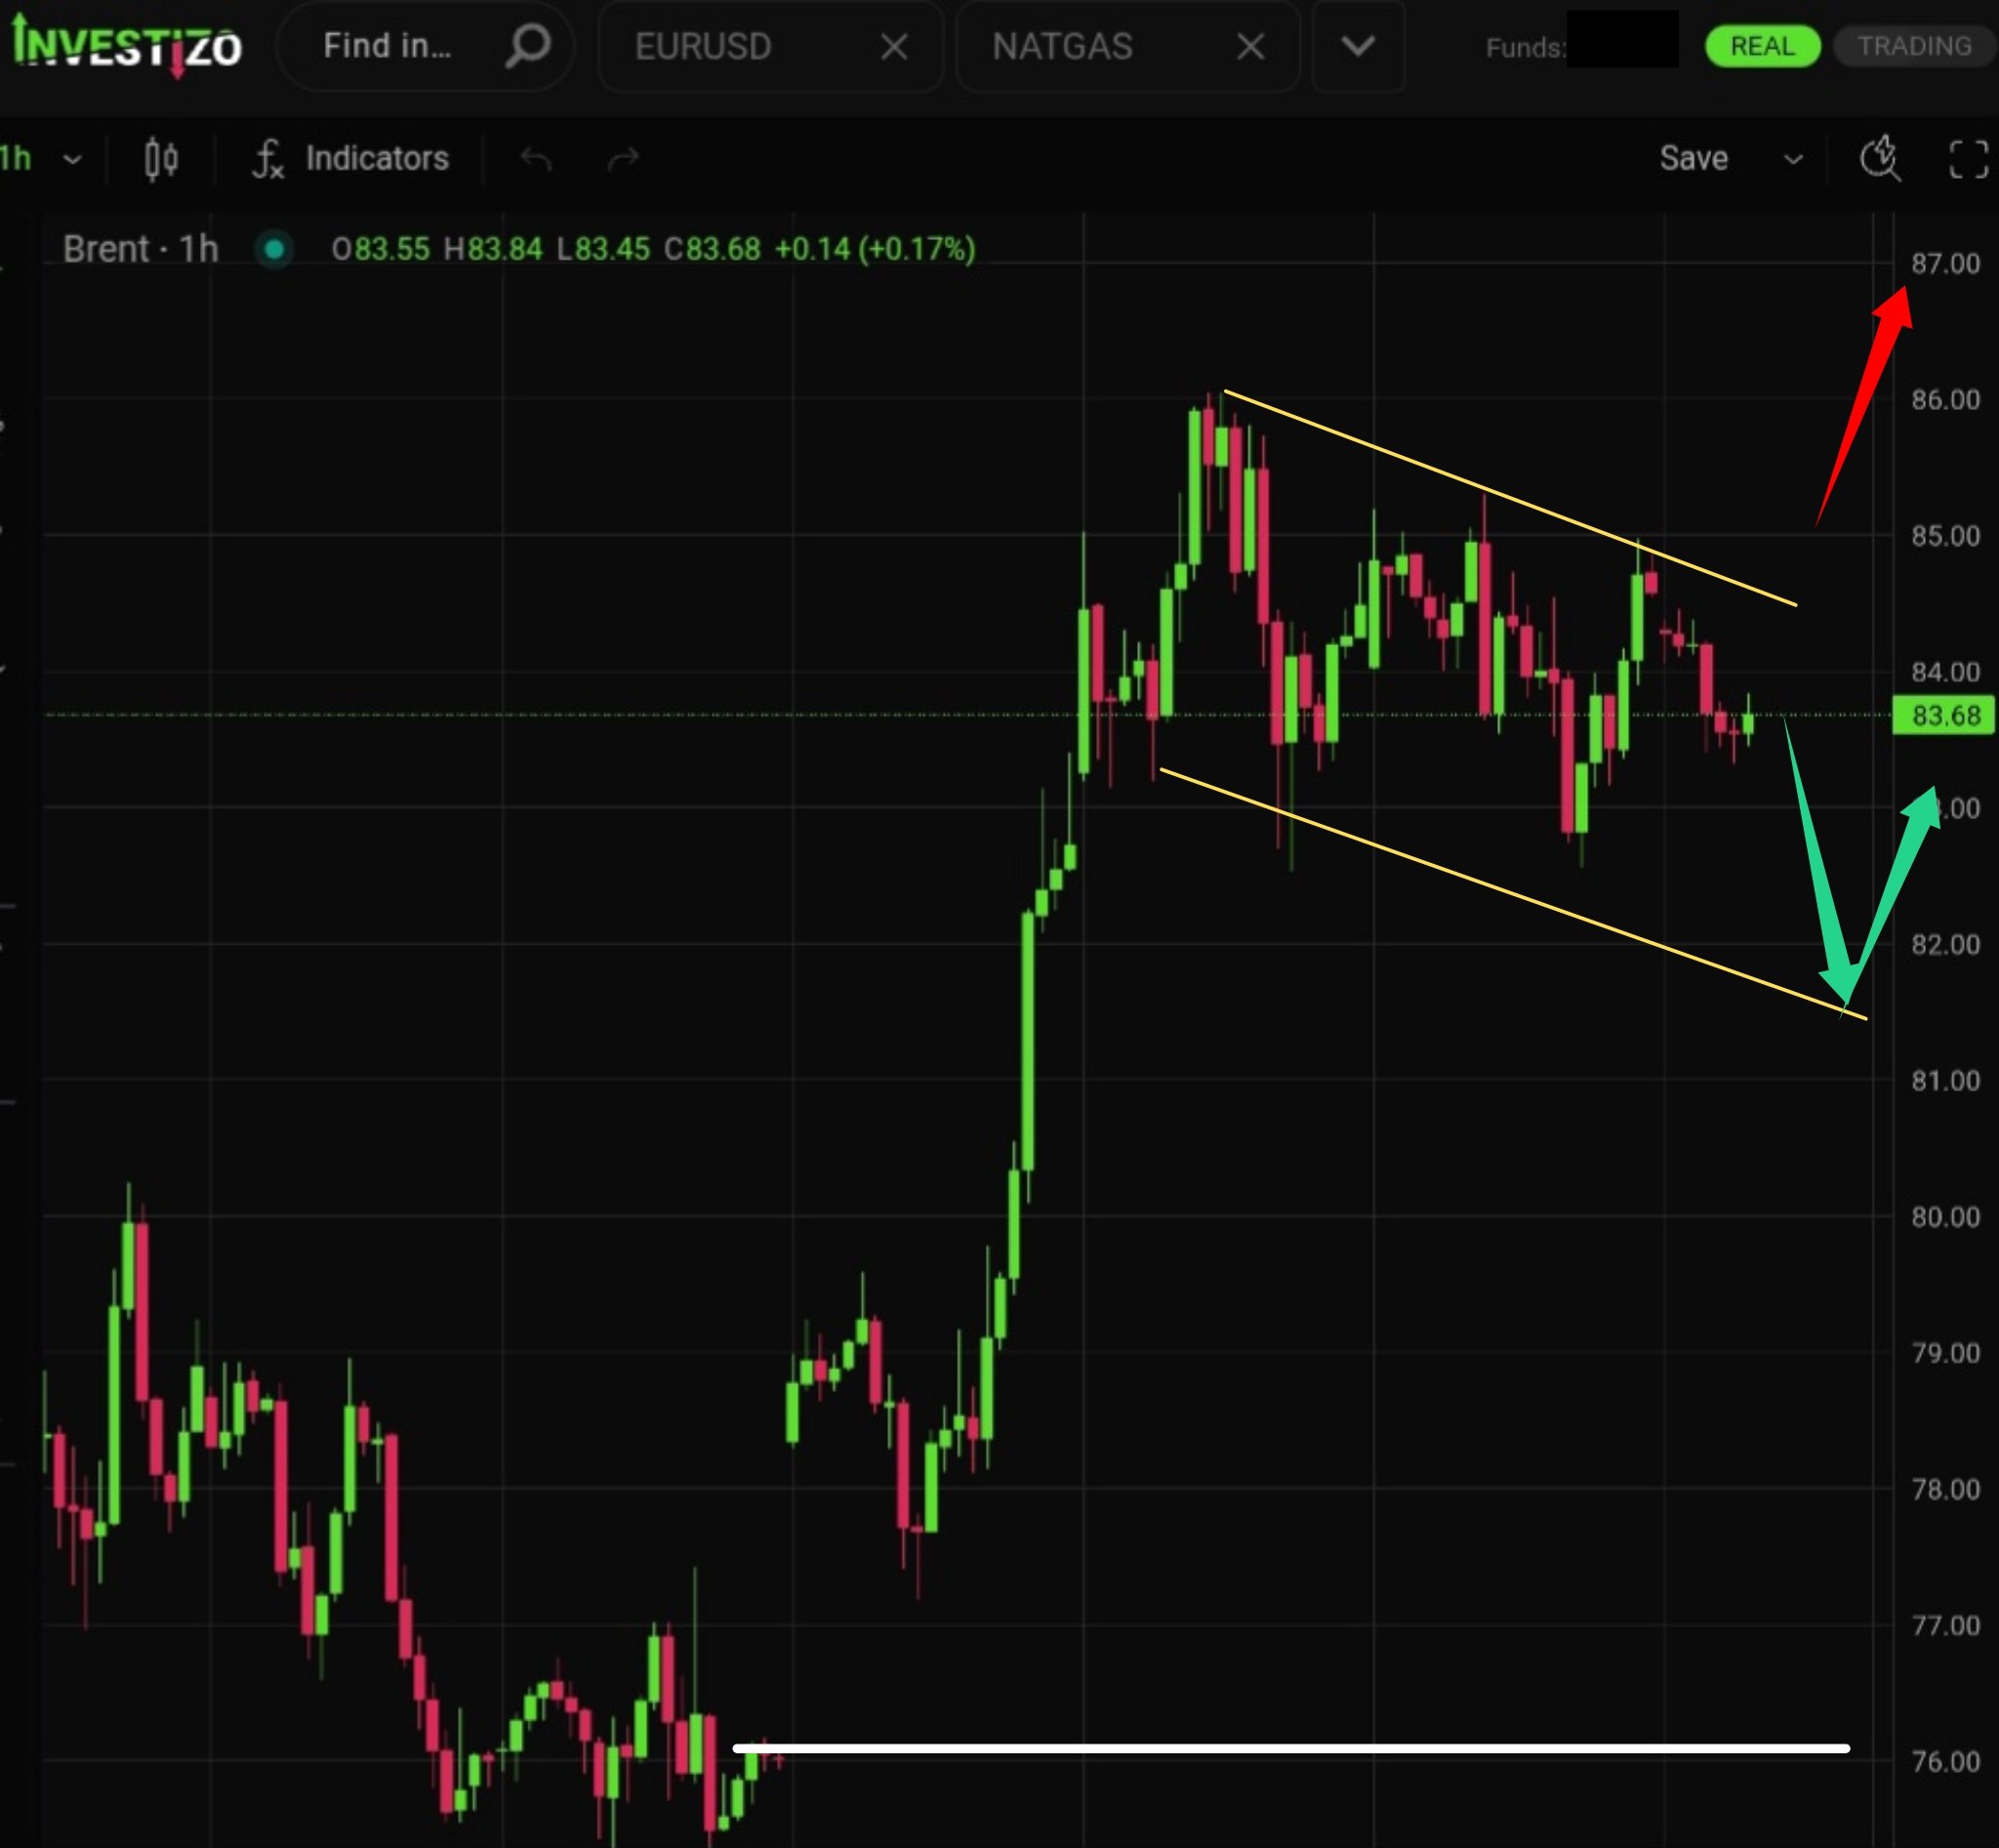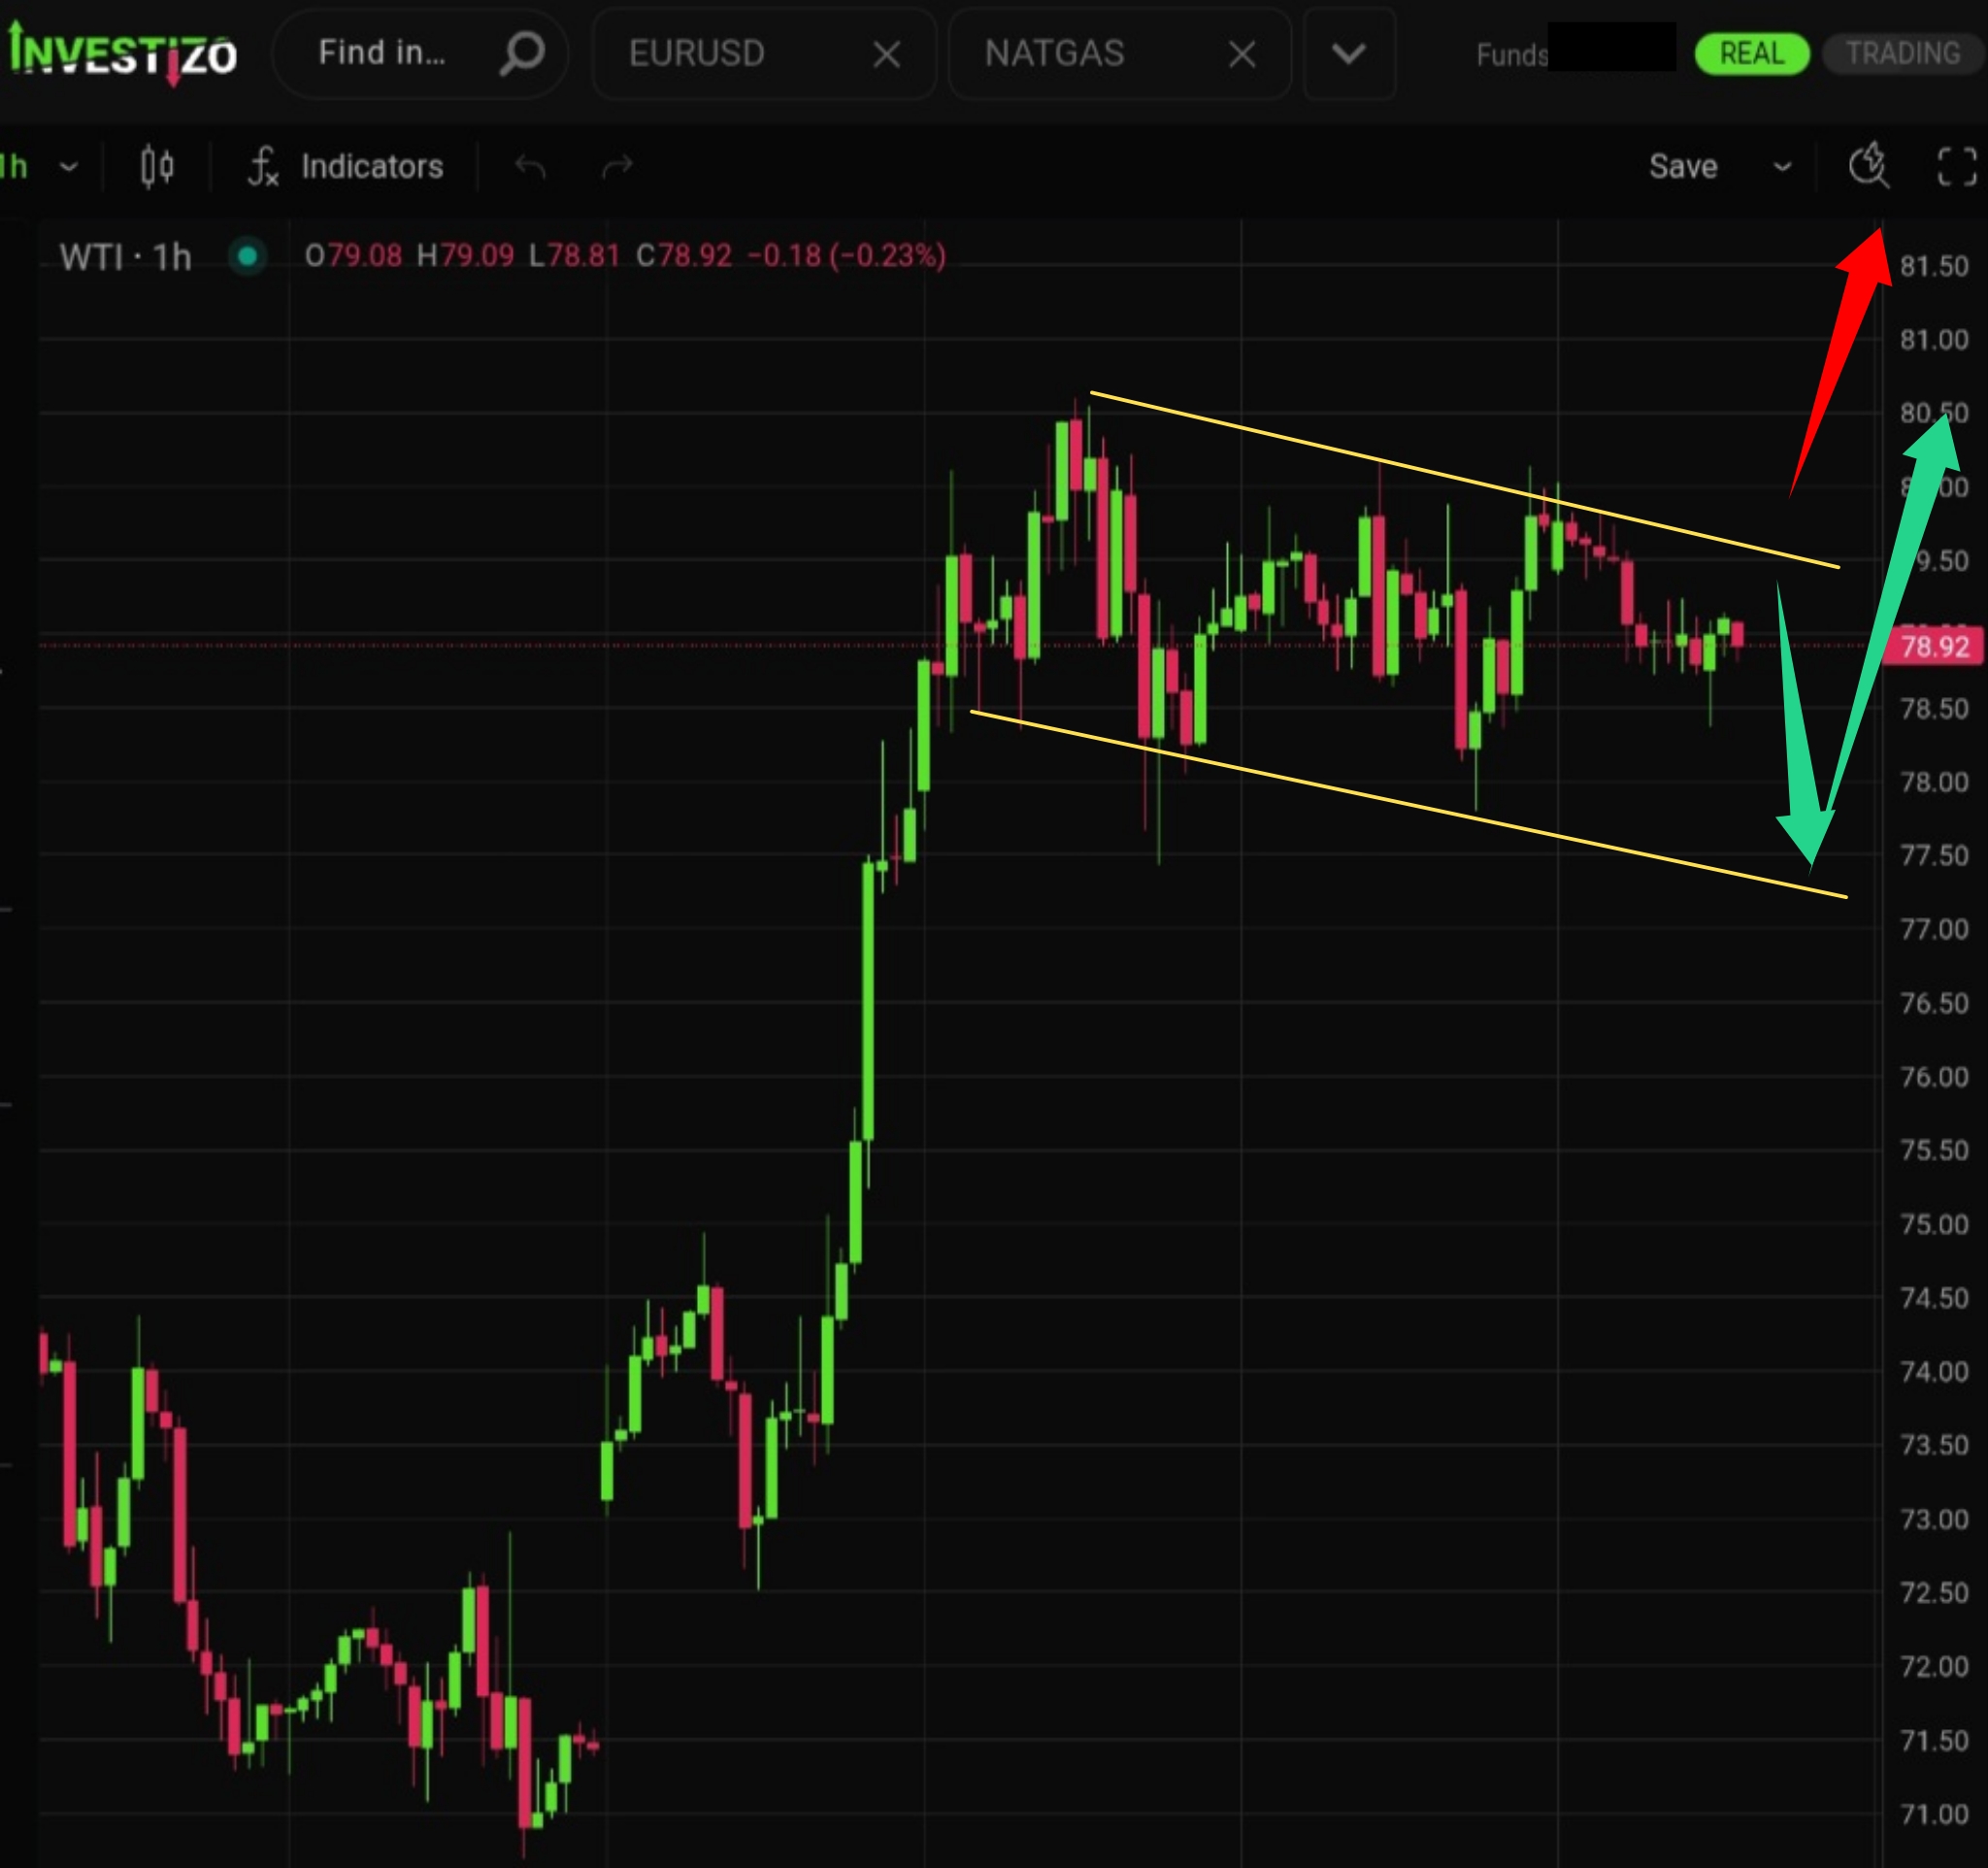
WTI Crude Oil, Technical Analysis – H1
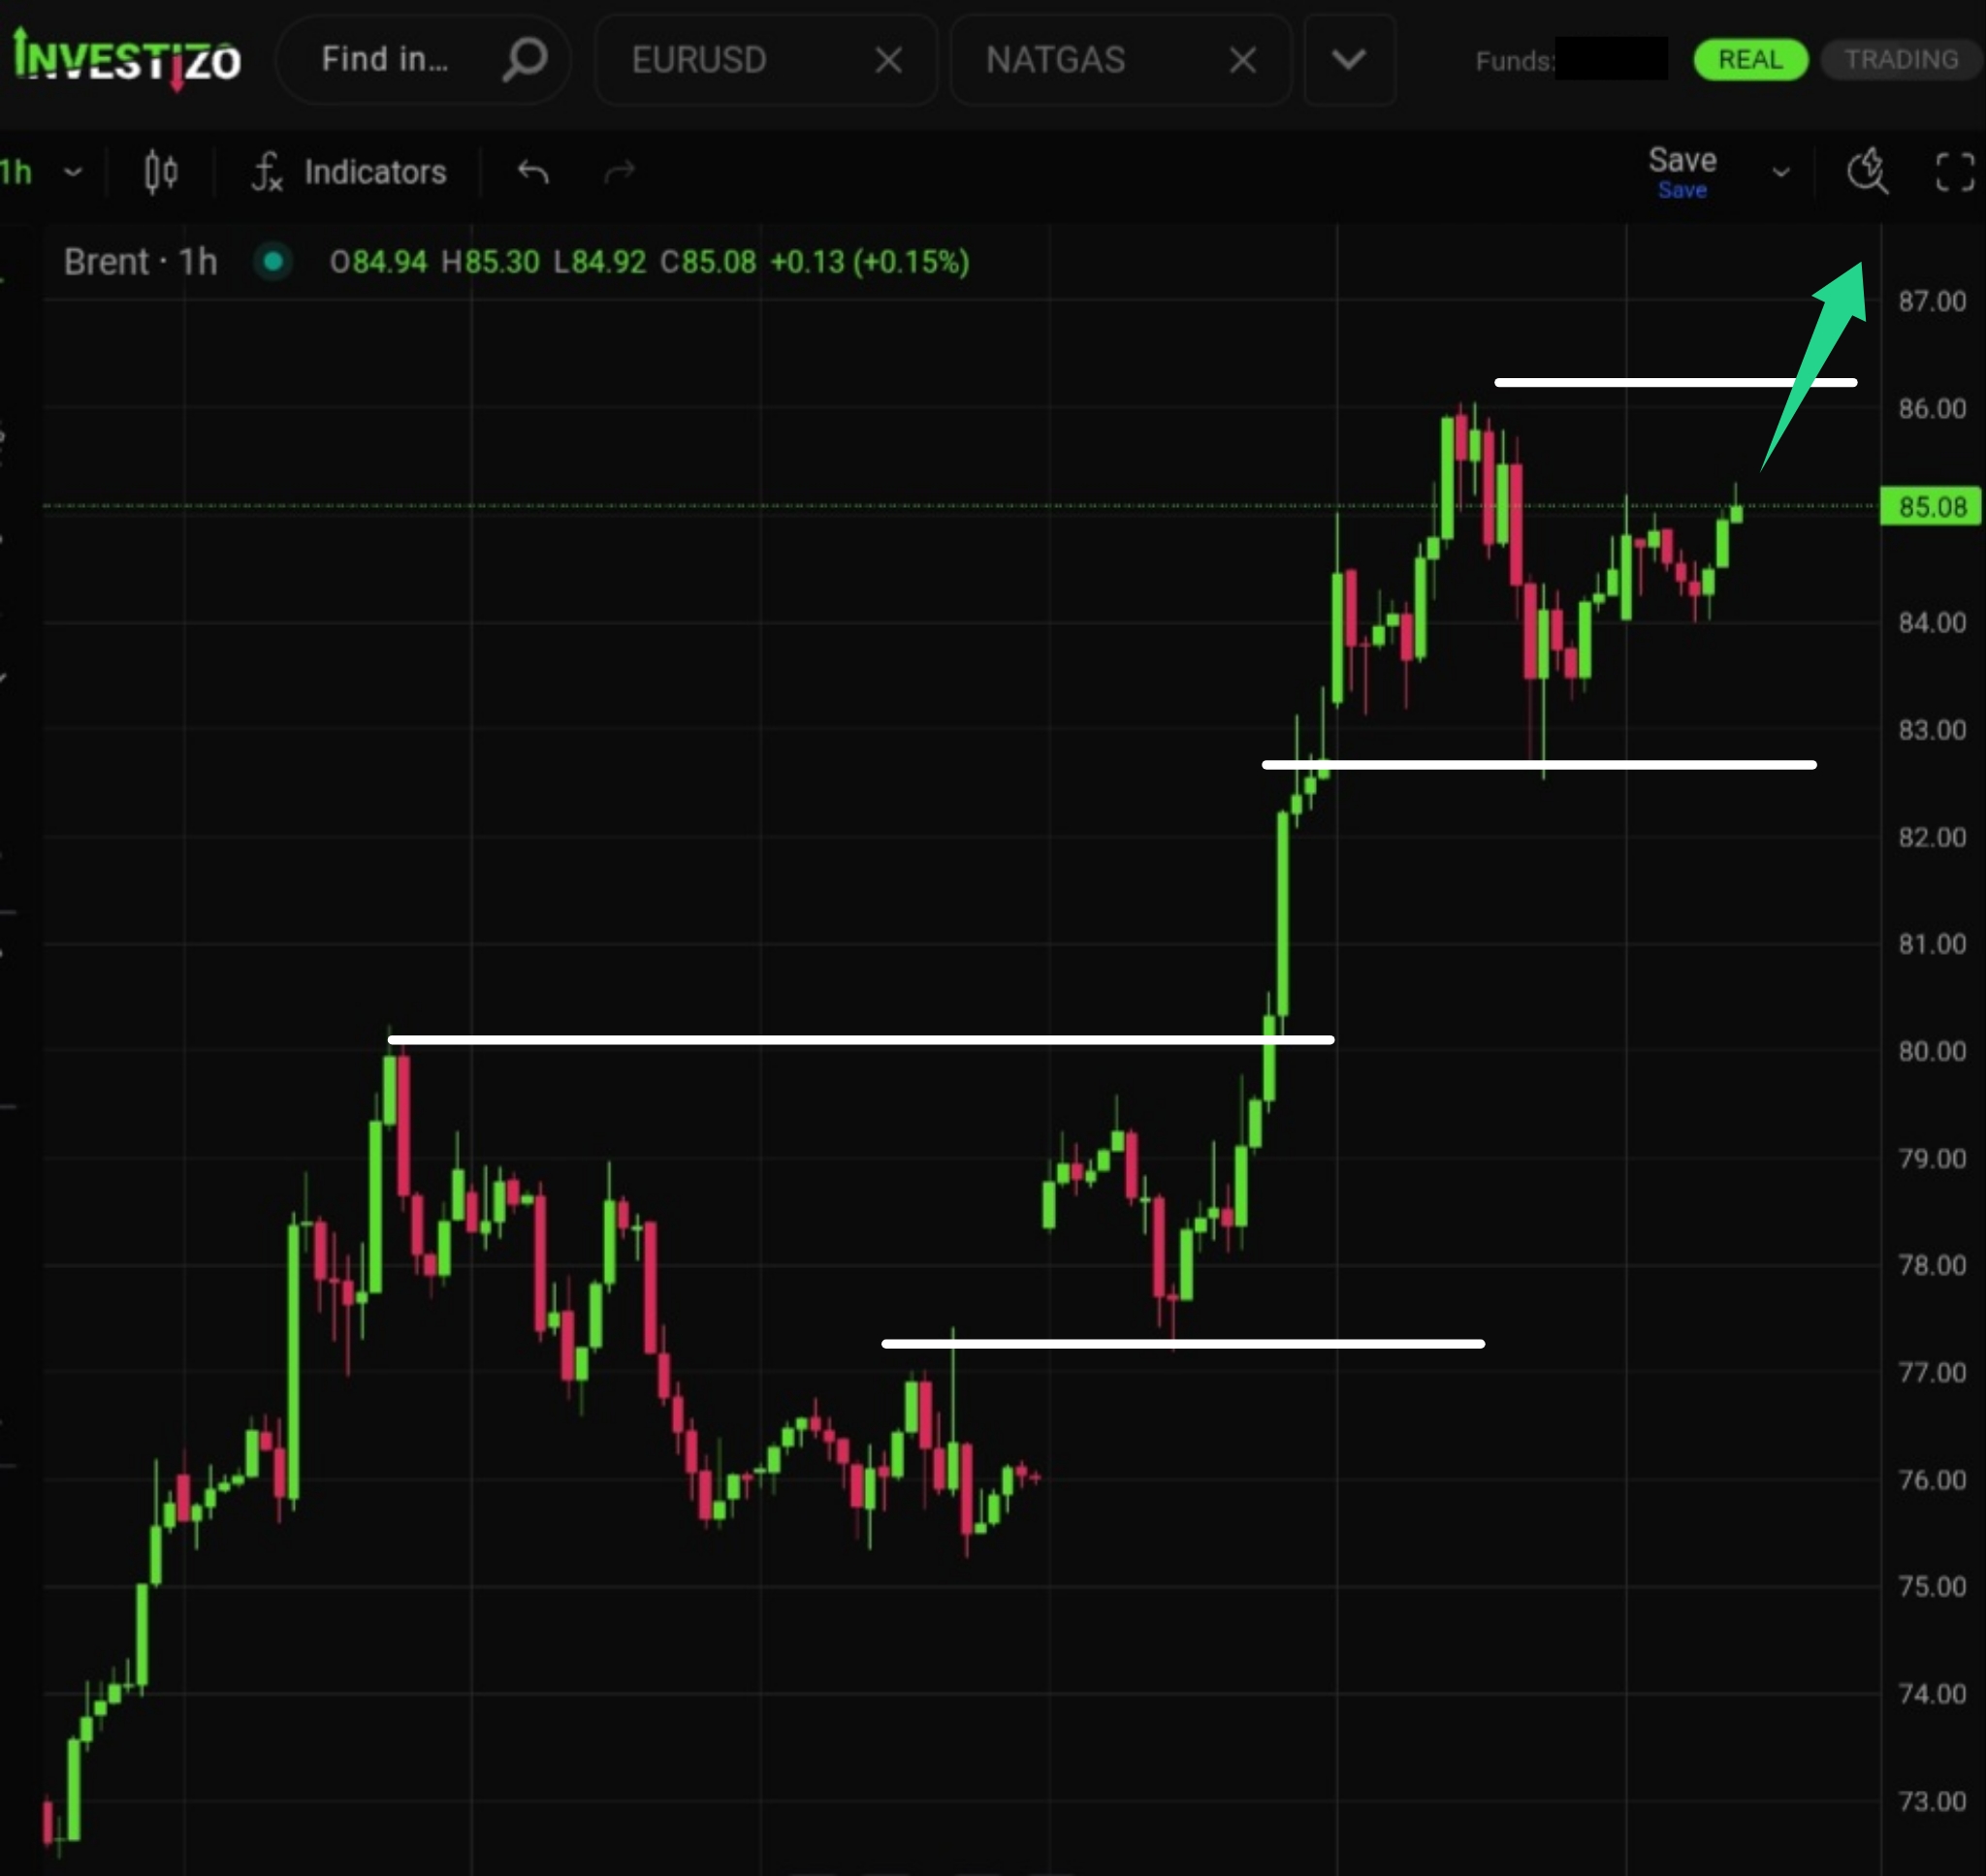
A large “bull flag” continuation pattern has formed, signaling strong potential for further upside.
Investizo LTD. Business company number 25432 BC 2019
Suite 305, Griffith Corporate Centre,
P.O. Box 1510, Beachmont, Kingstown,
St. Vincent and the Grenadines
DUNS 817053497
Phone:+996312610515
E-mail: [email protected]
© 2019-2026 Investizo 18+ All rights reserved
Risk Warning: CFDs are complex financial products traded on margin. Trading CFDs is risky and may not be suitable for all investors. Ensure you understand the risks involved as you may lose all your invested capital.
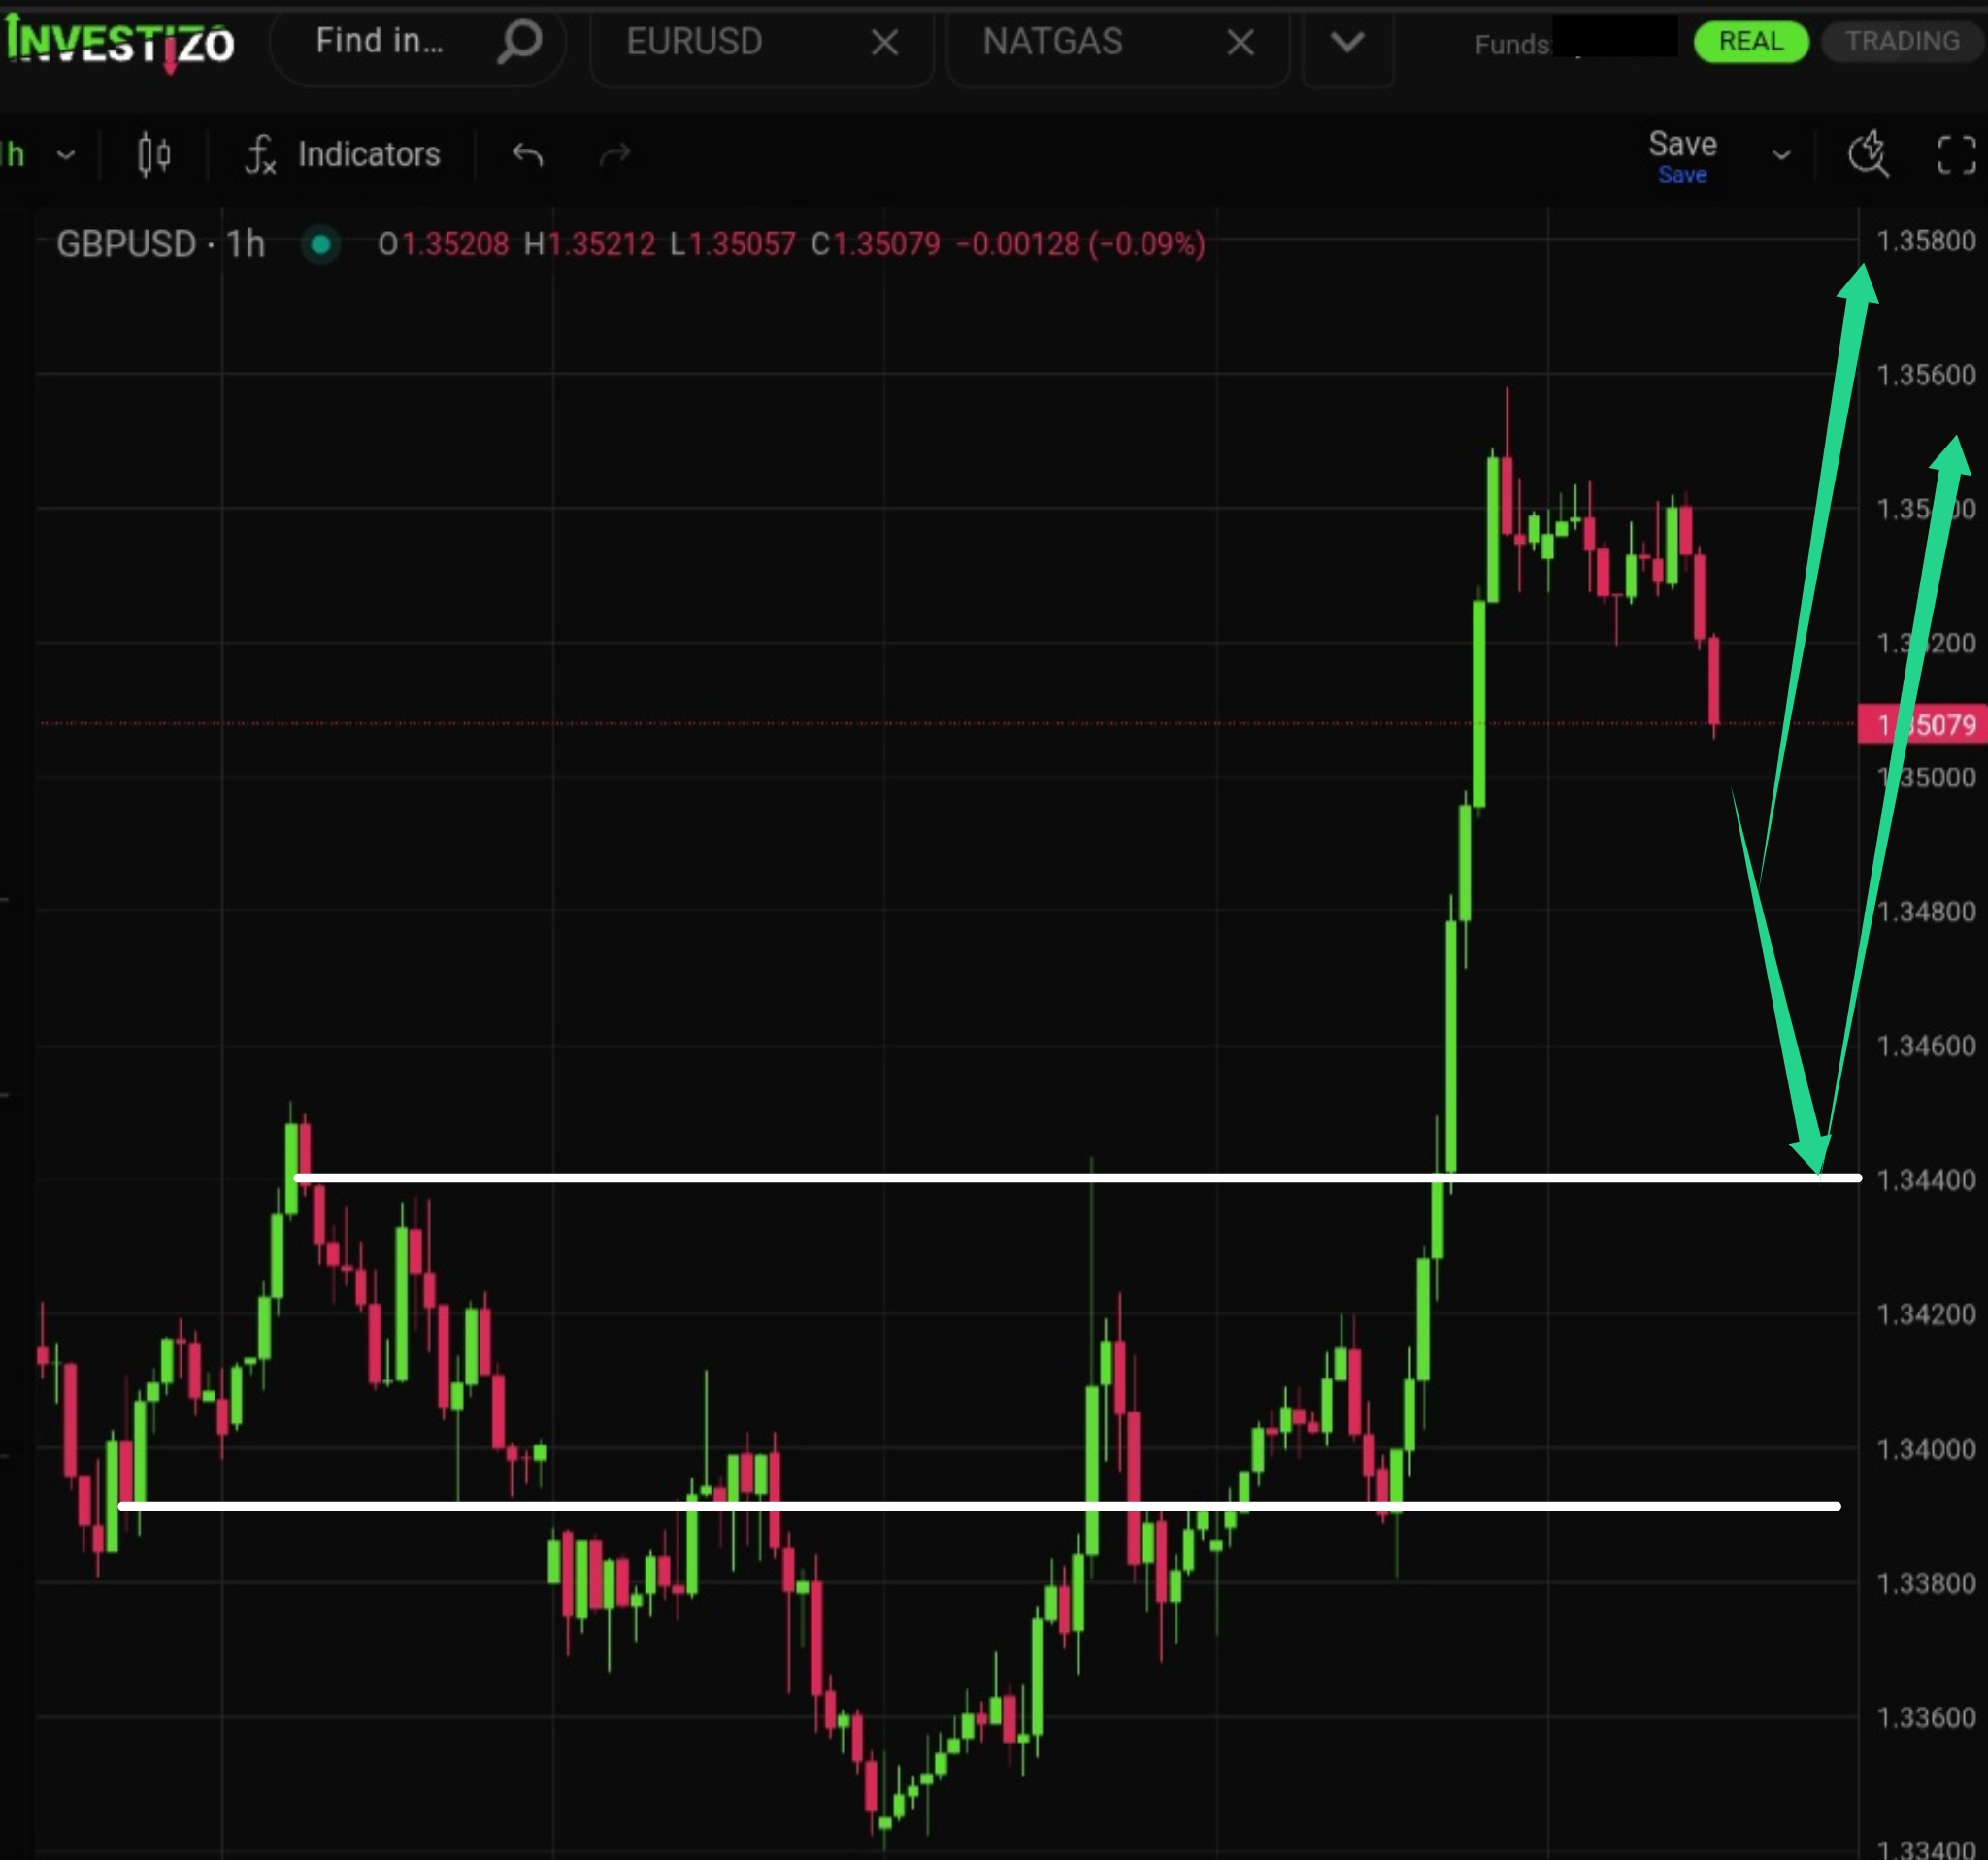
A large “bull flag” continuation pattern has formed, signaling strong potential for further upside.
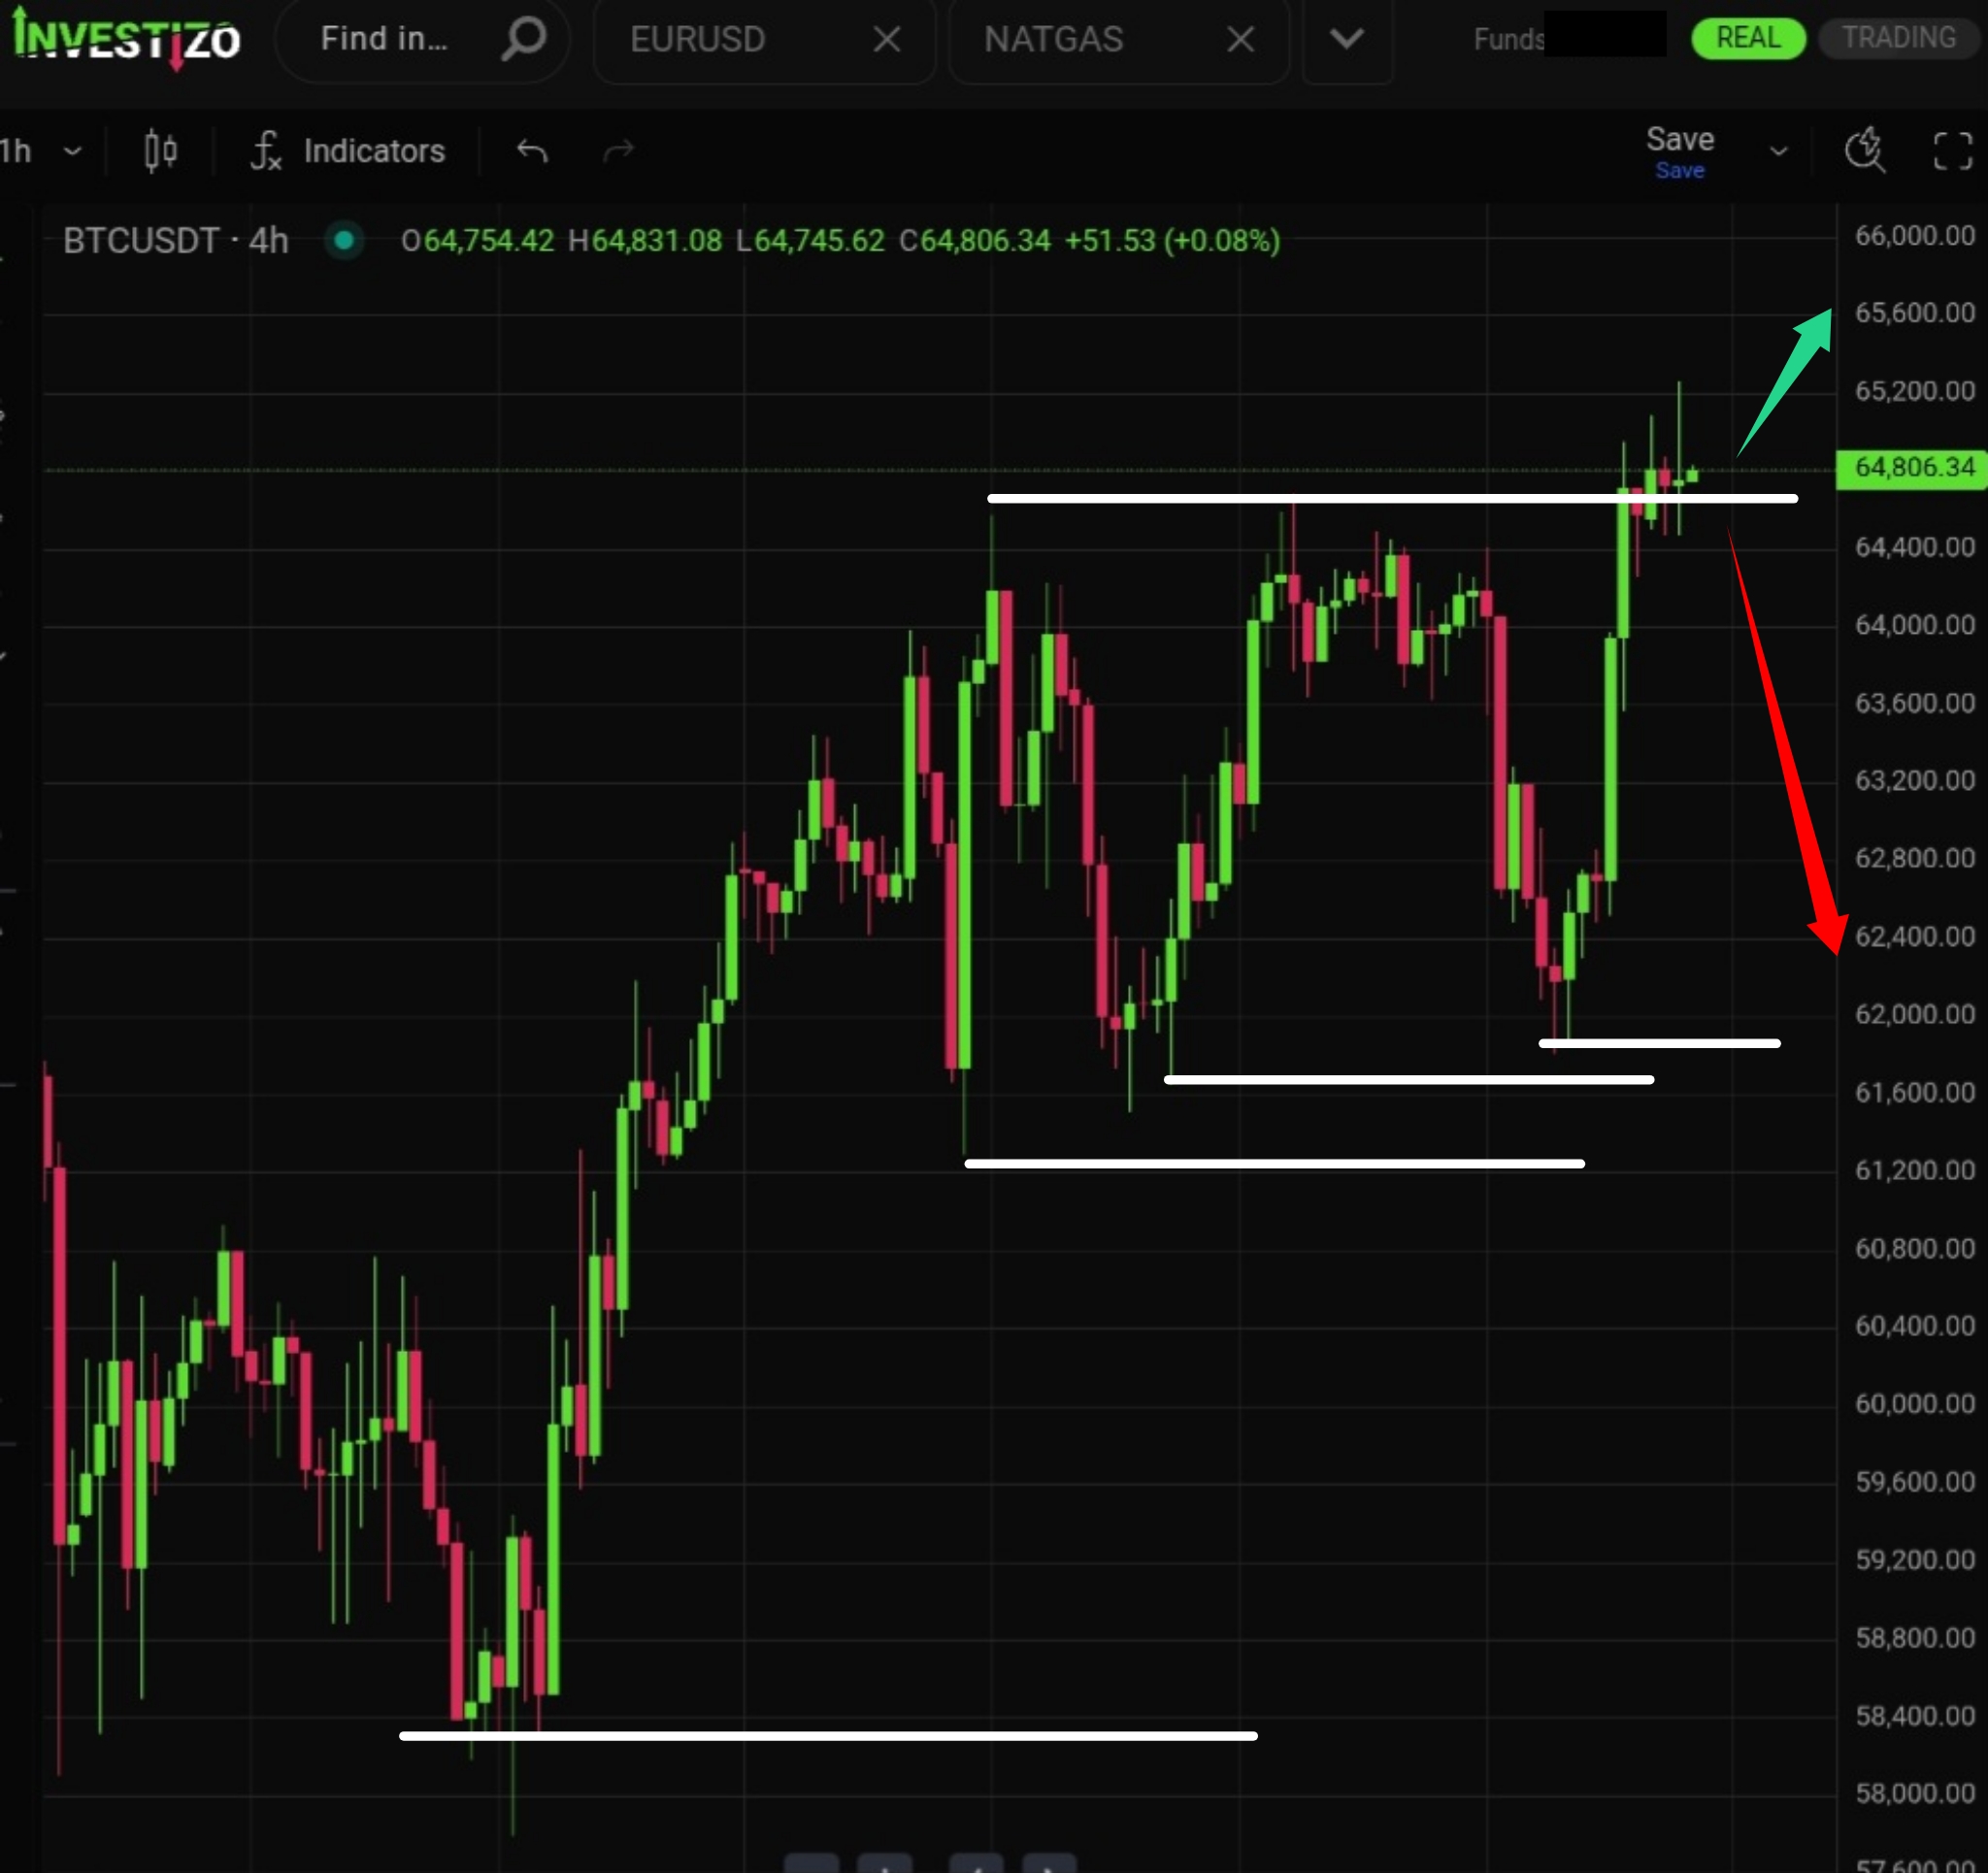
The pair delivered a strong upward impulse, followed by a fairly intensive local correction.
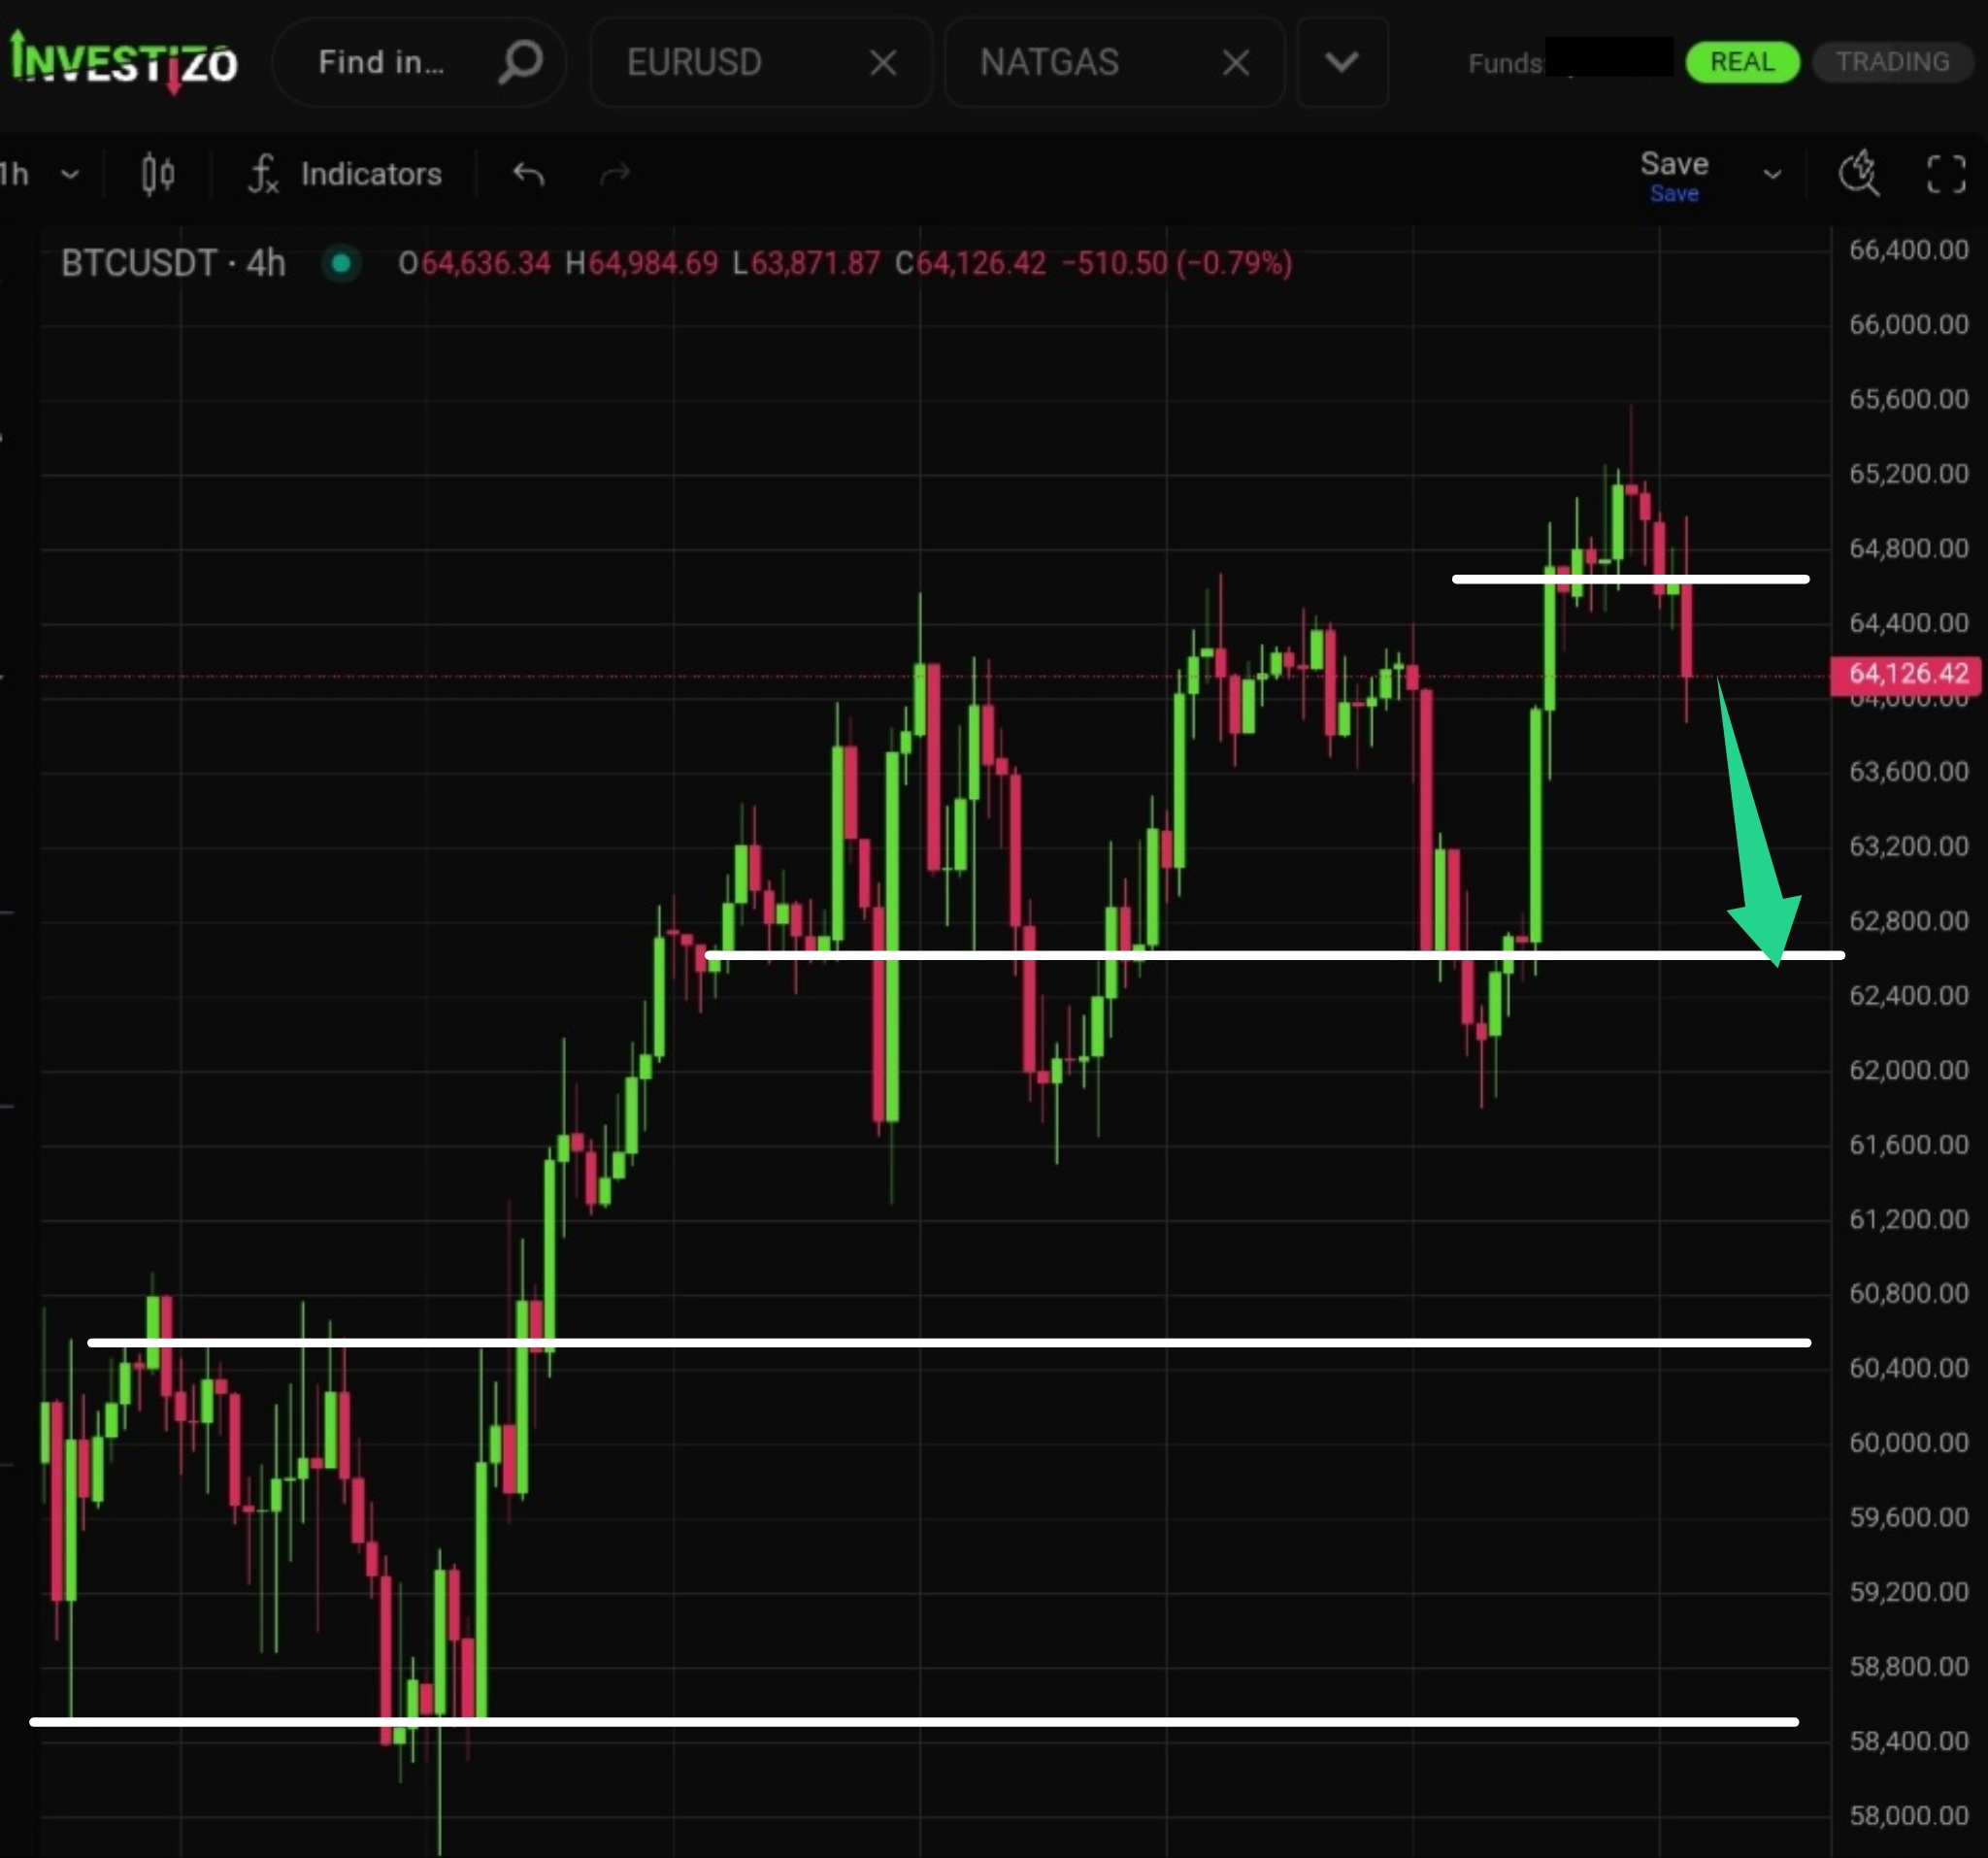
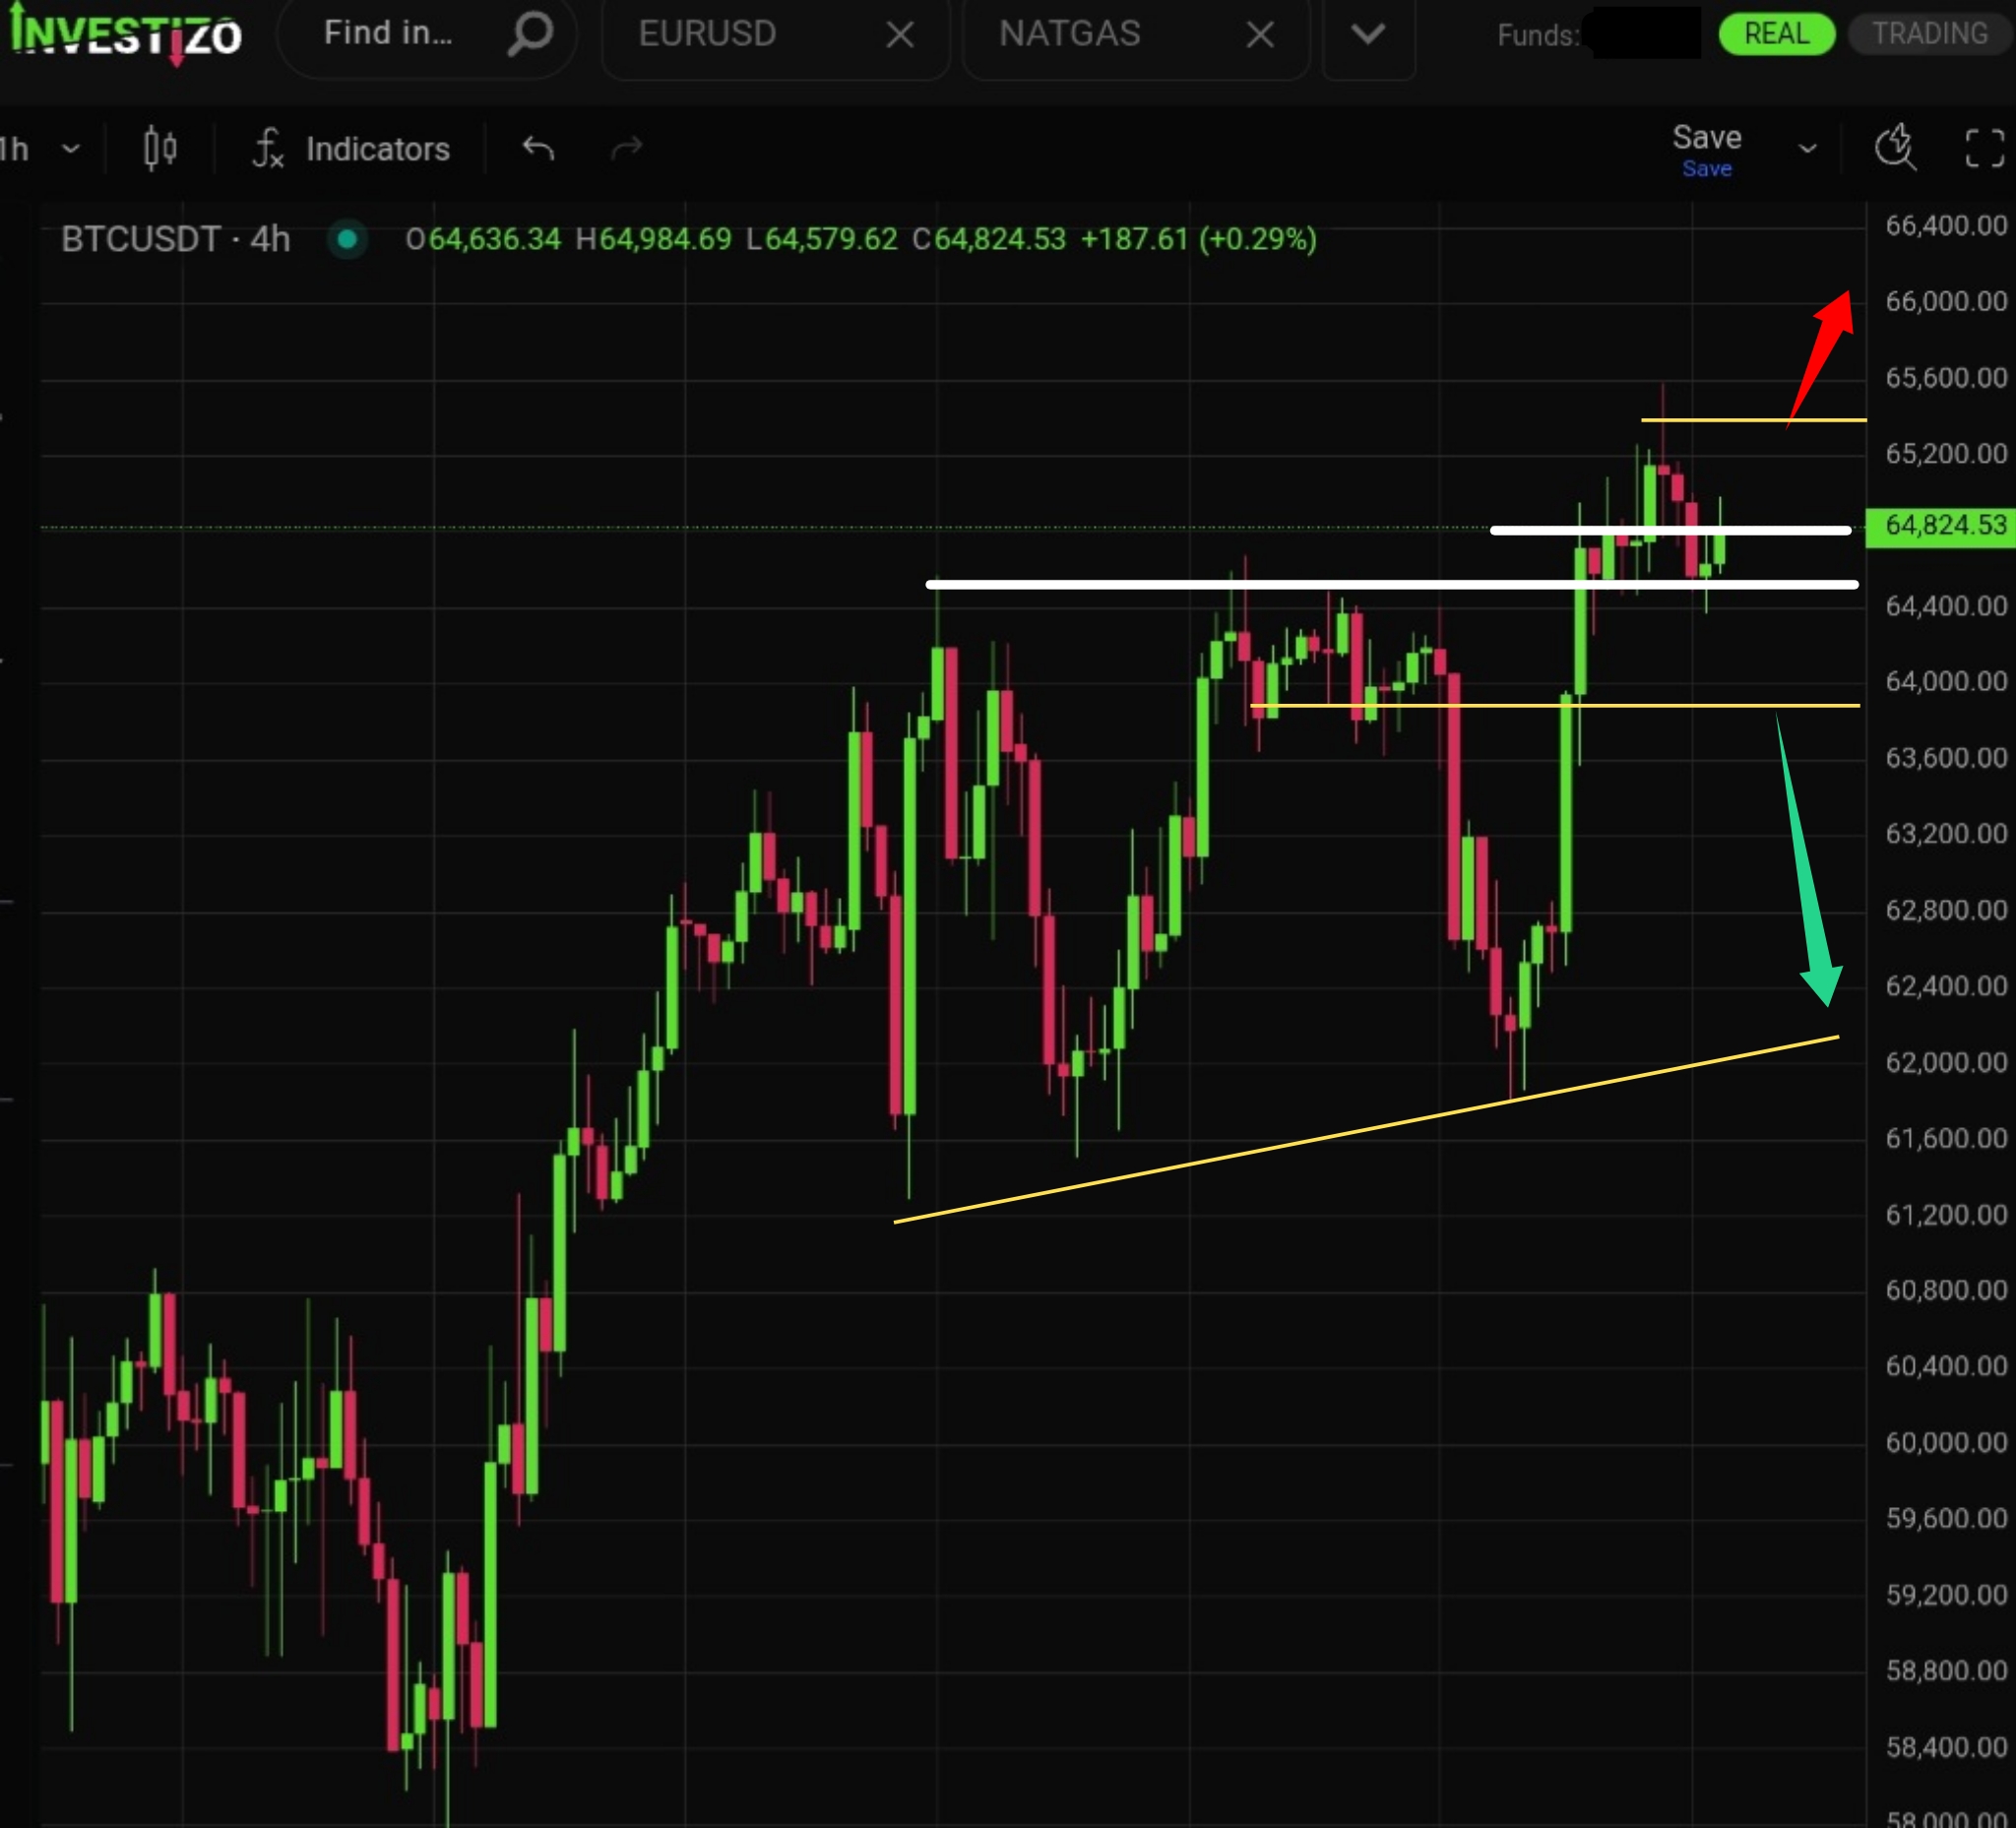
Bears predictably demonstrated strength at the first significant psychological resistance level of $65,000.
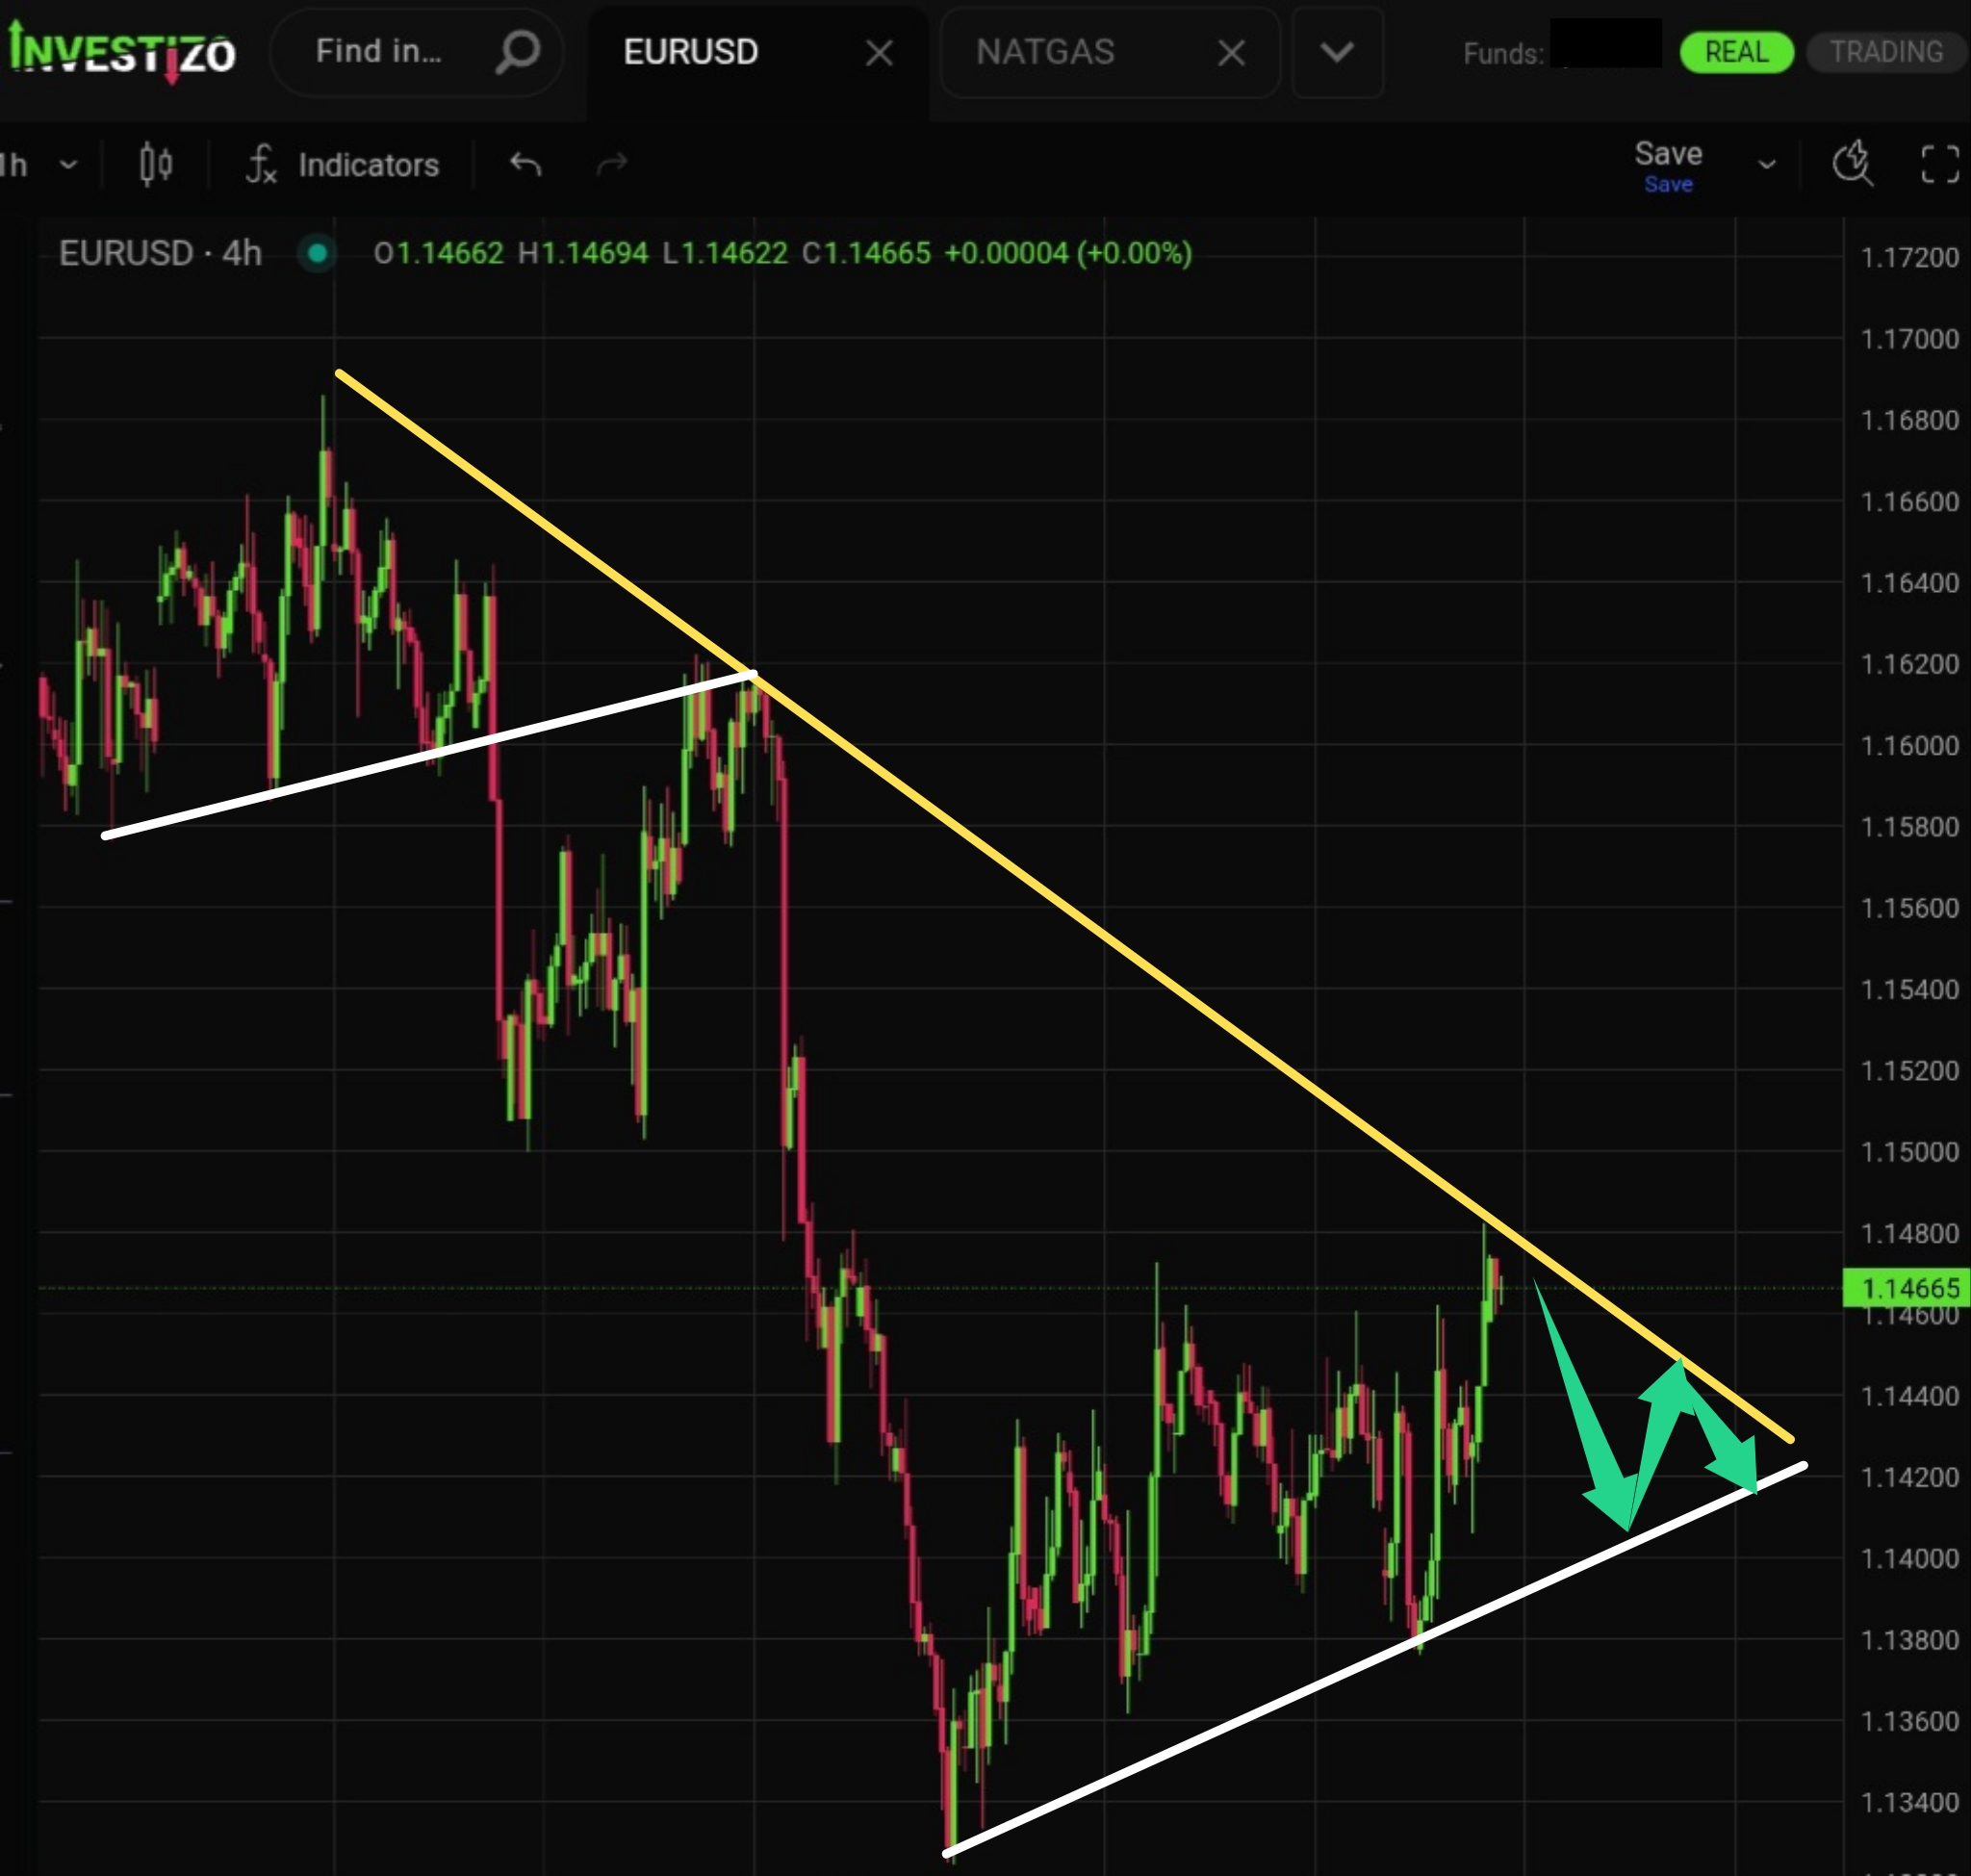
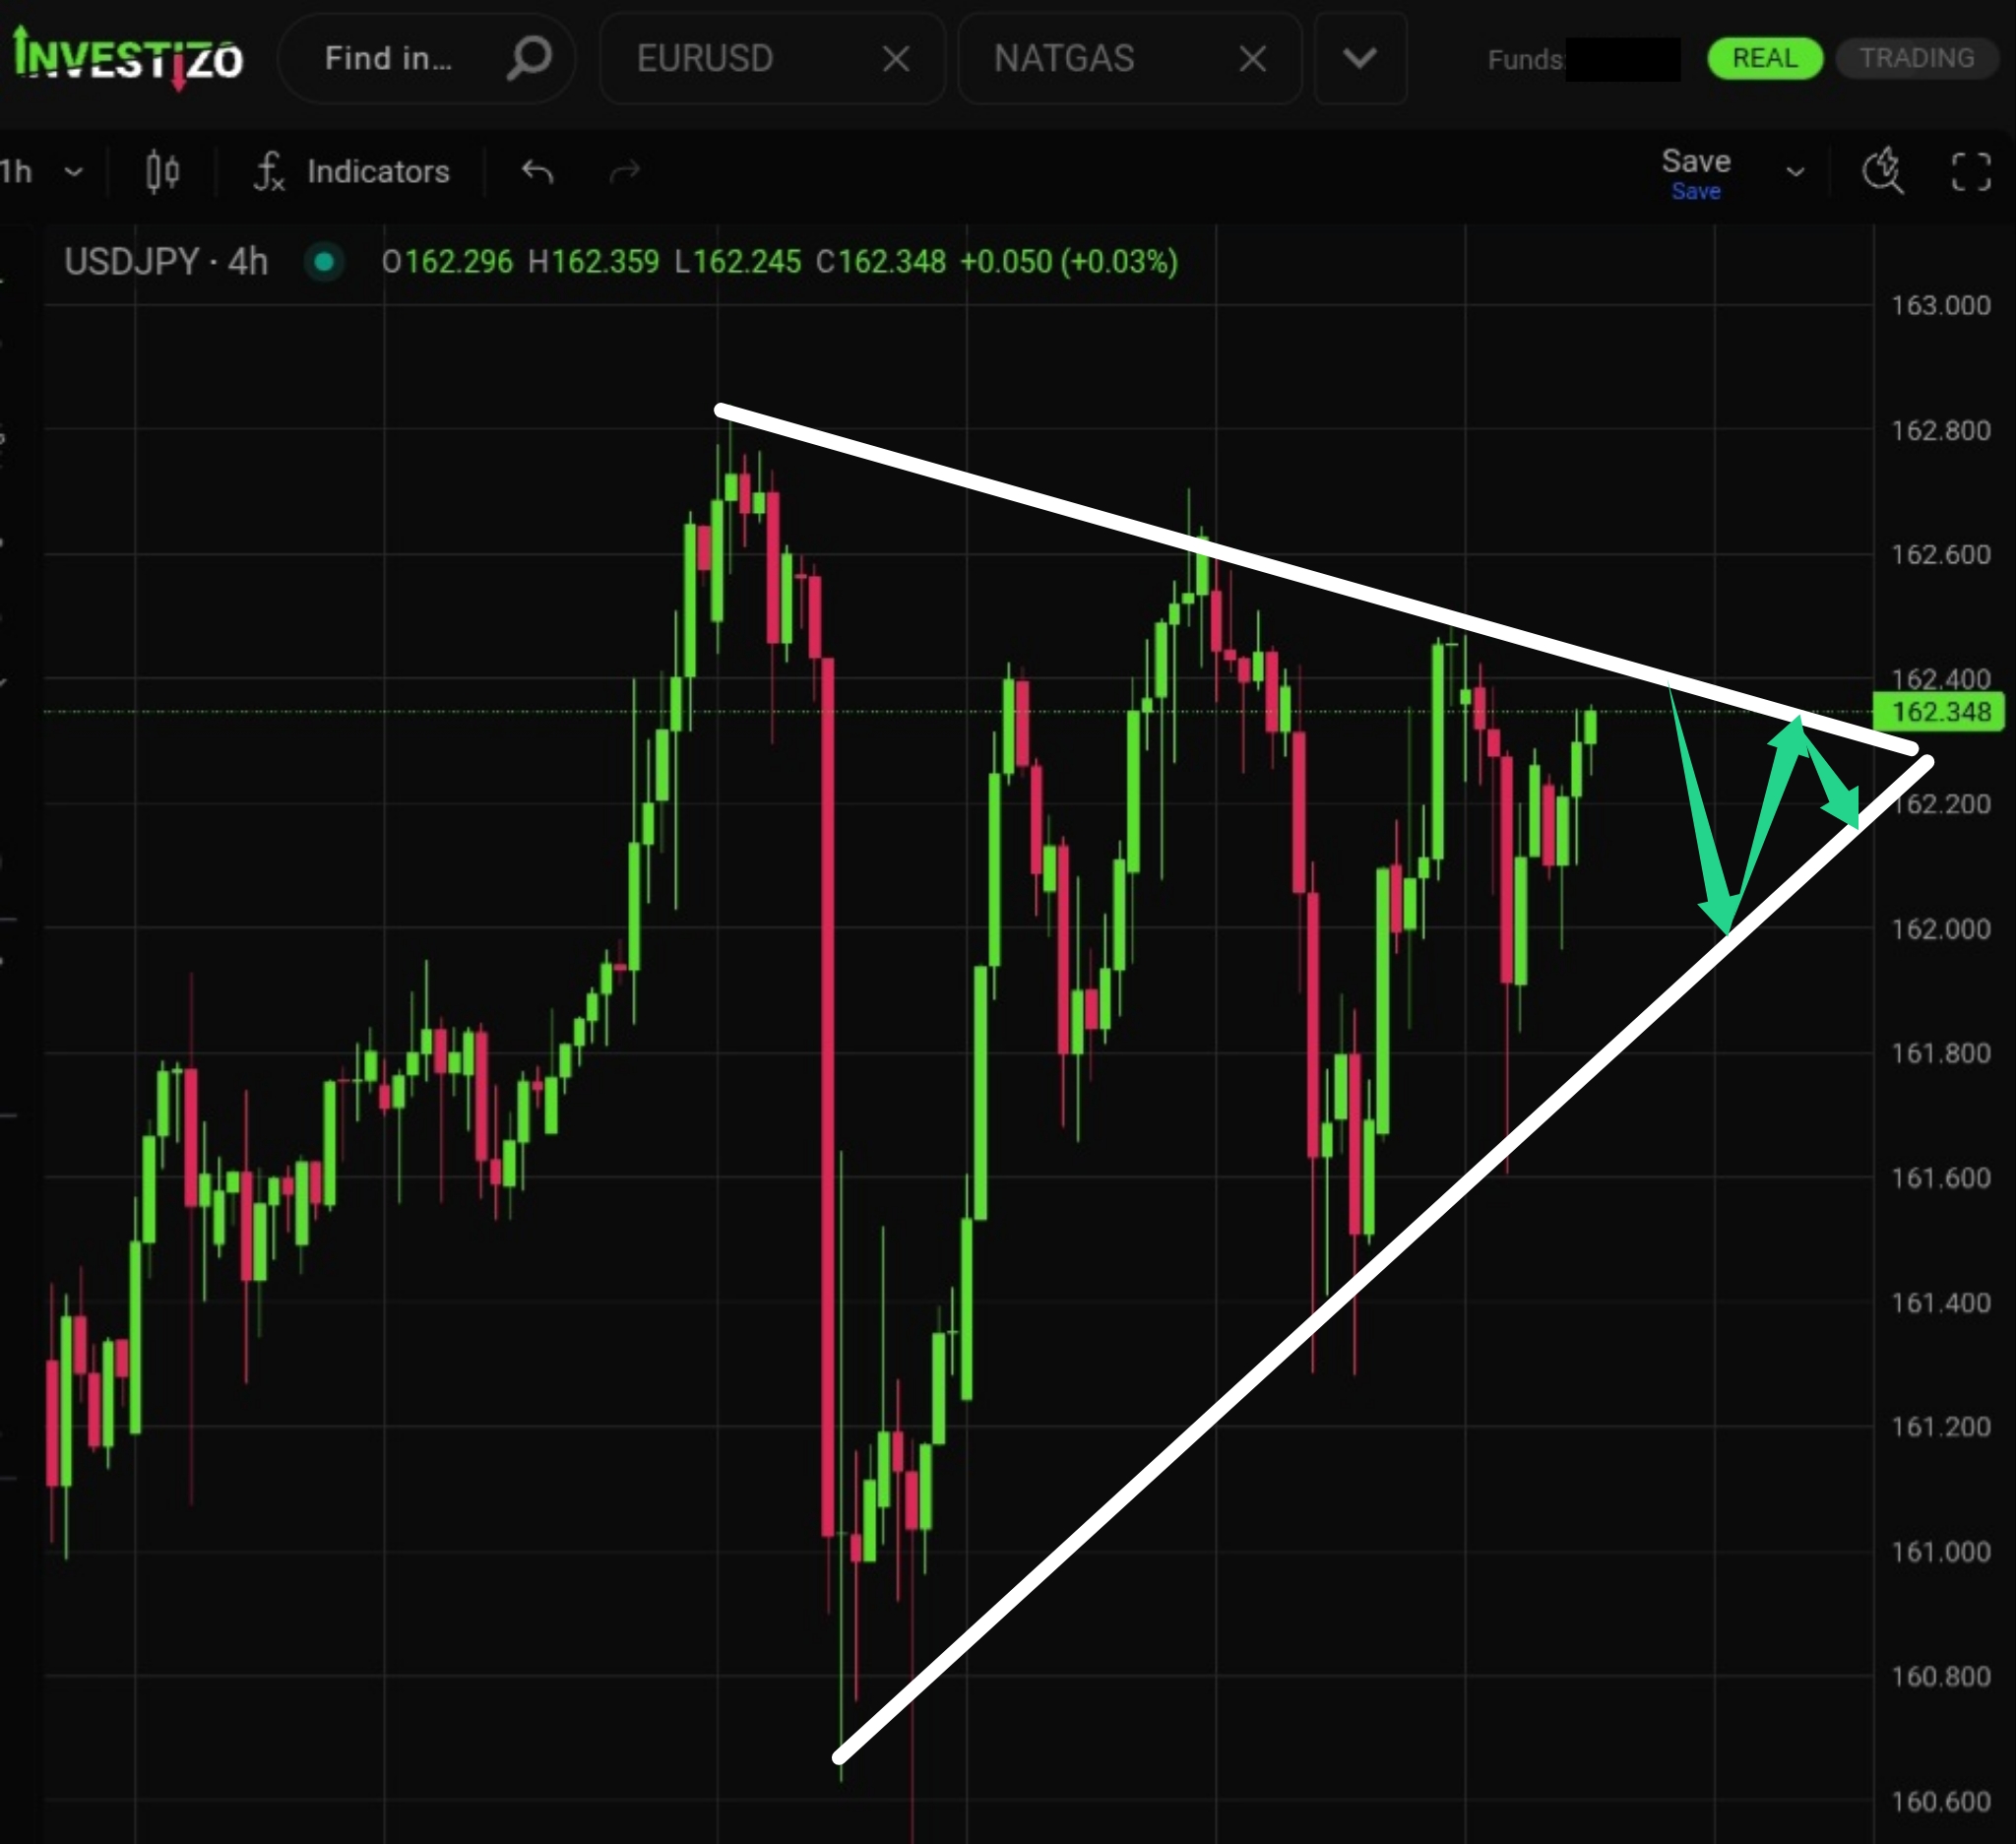
The pair is approaching a decisive moment. The triangular consolidation range is nearly filled.
The pair is currently testing the medium-term downtrend line, which is likely to trigger a downward reversal.
Bitcoin (BTC/USD) trades at 64,825 this Thursday morning, holding its ground as the broader market weighs near-term institutional demand against long-term historical cycles.
Brent Crude trades at 83.86 this Thursday morning, pulling back slightly after spiking above 85.00 but maintaining a strong 13% gain on the week.
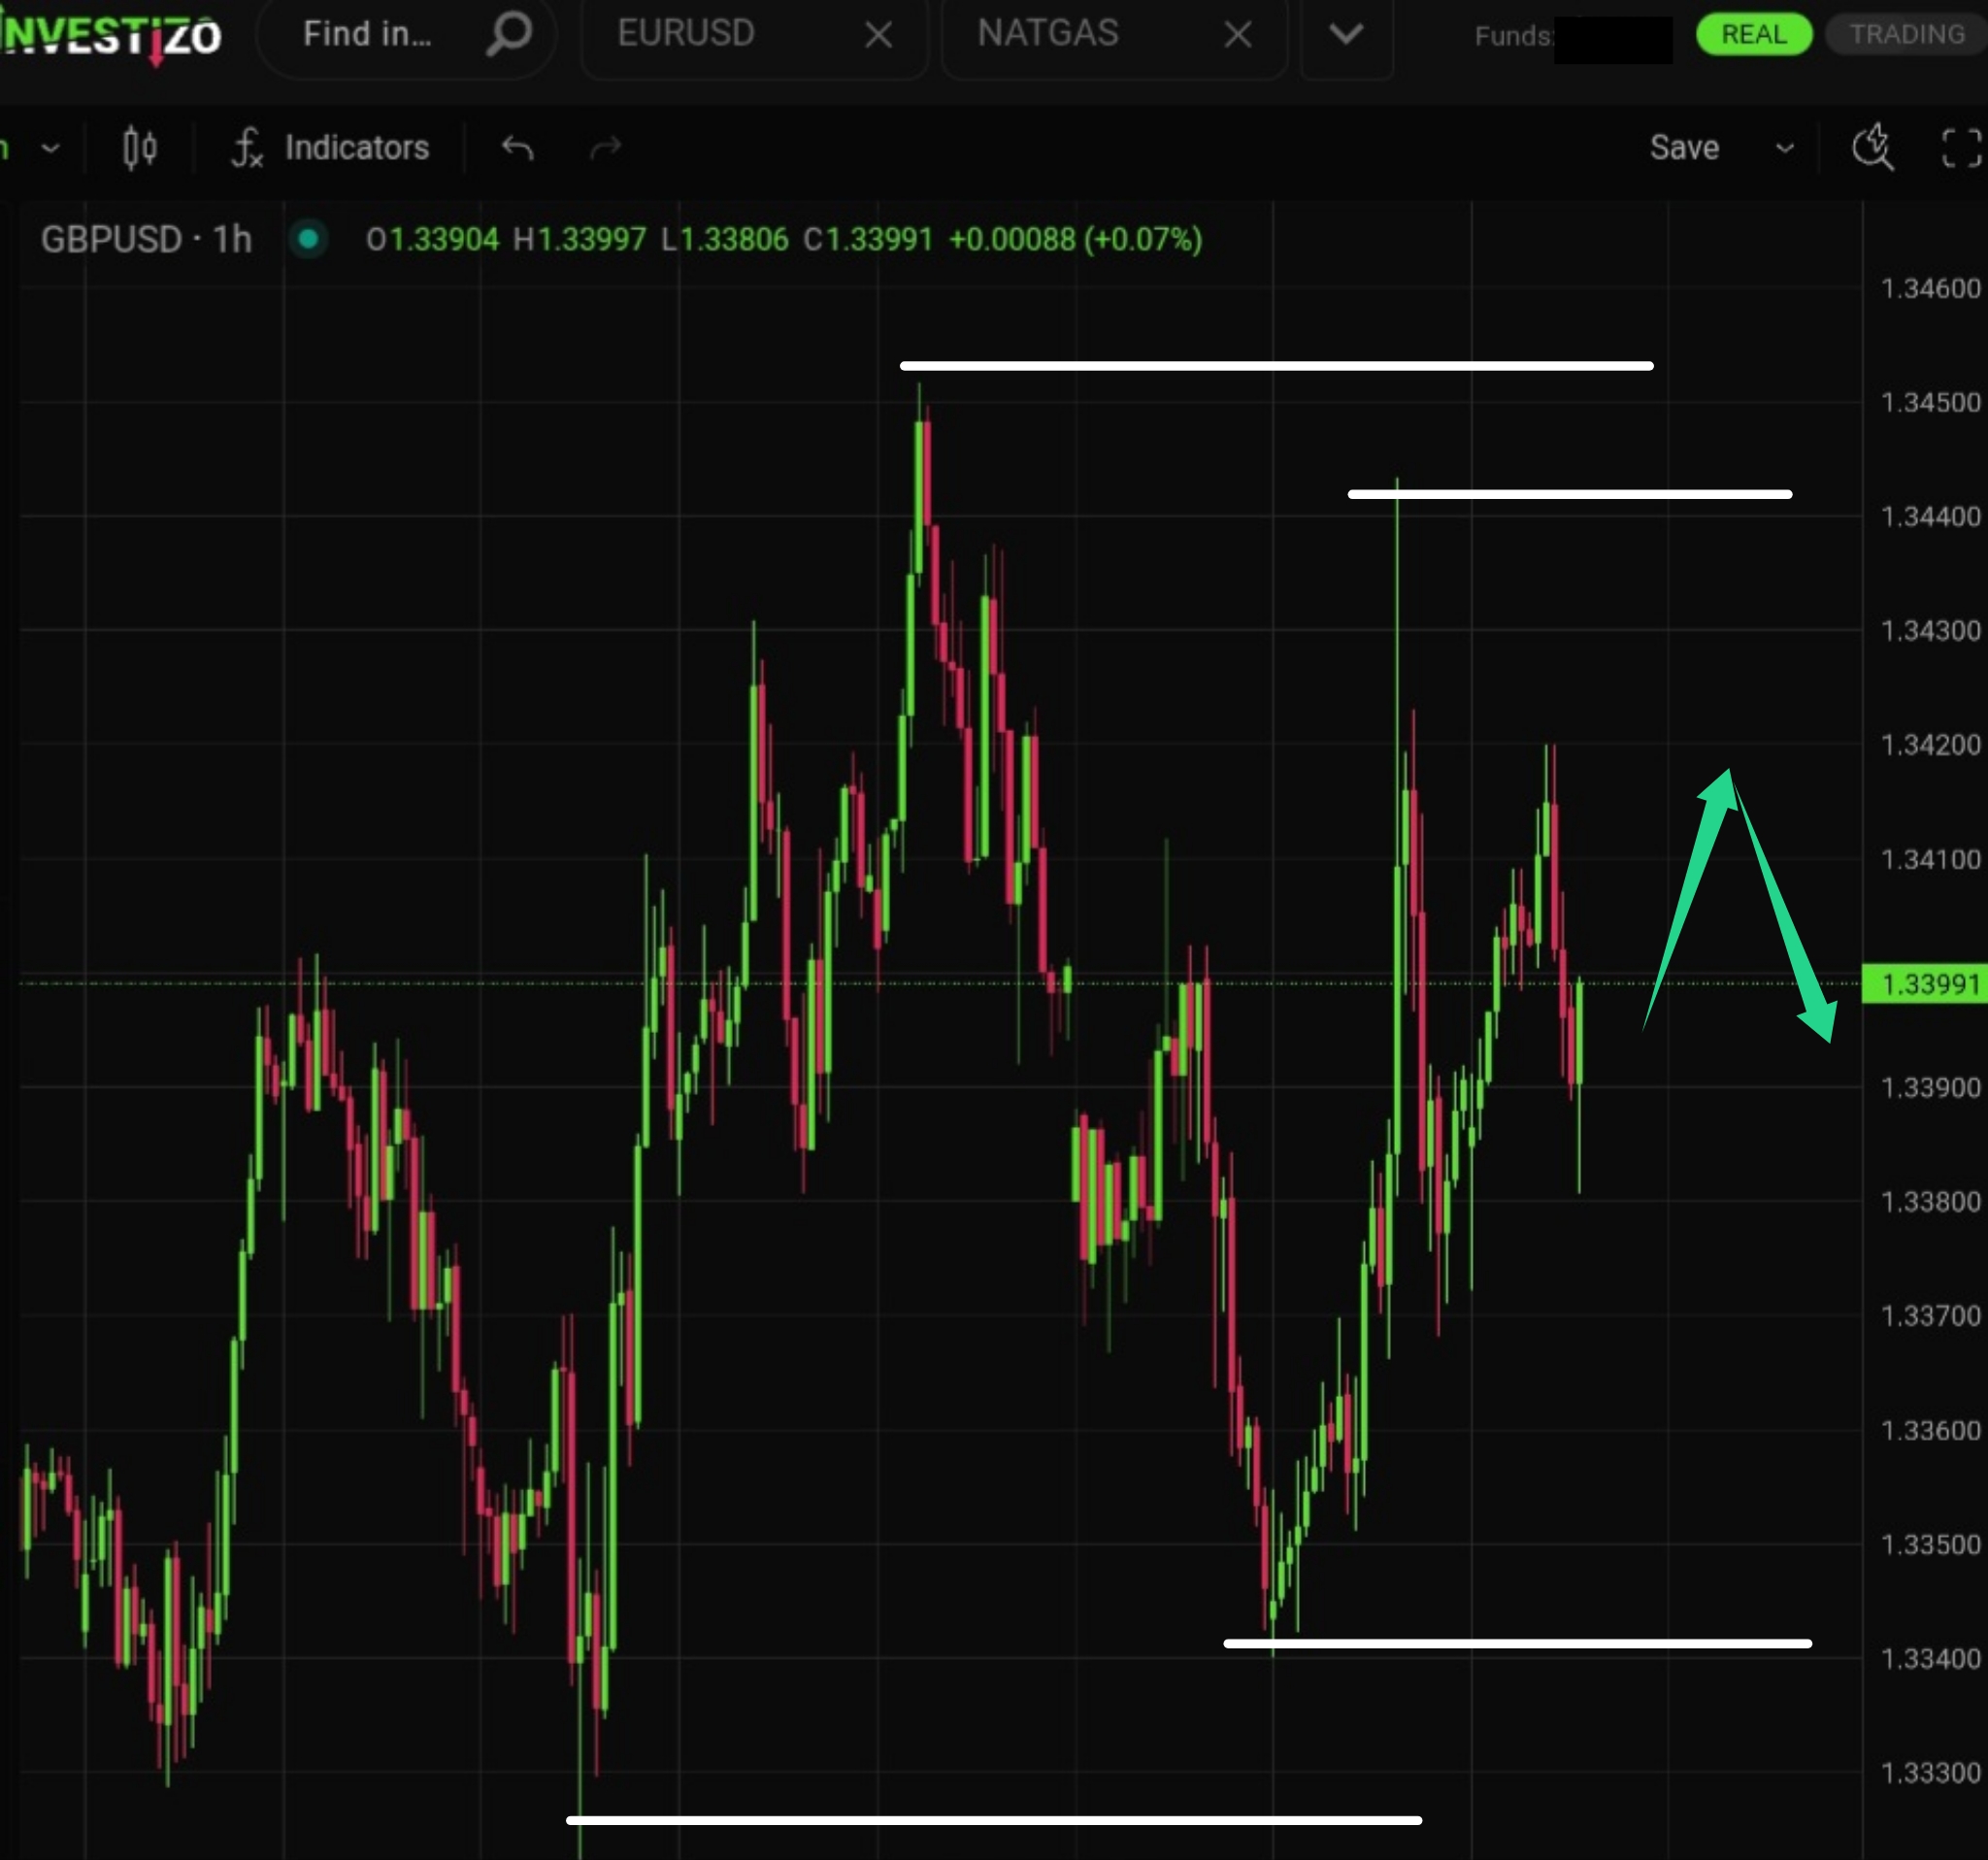
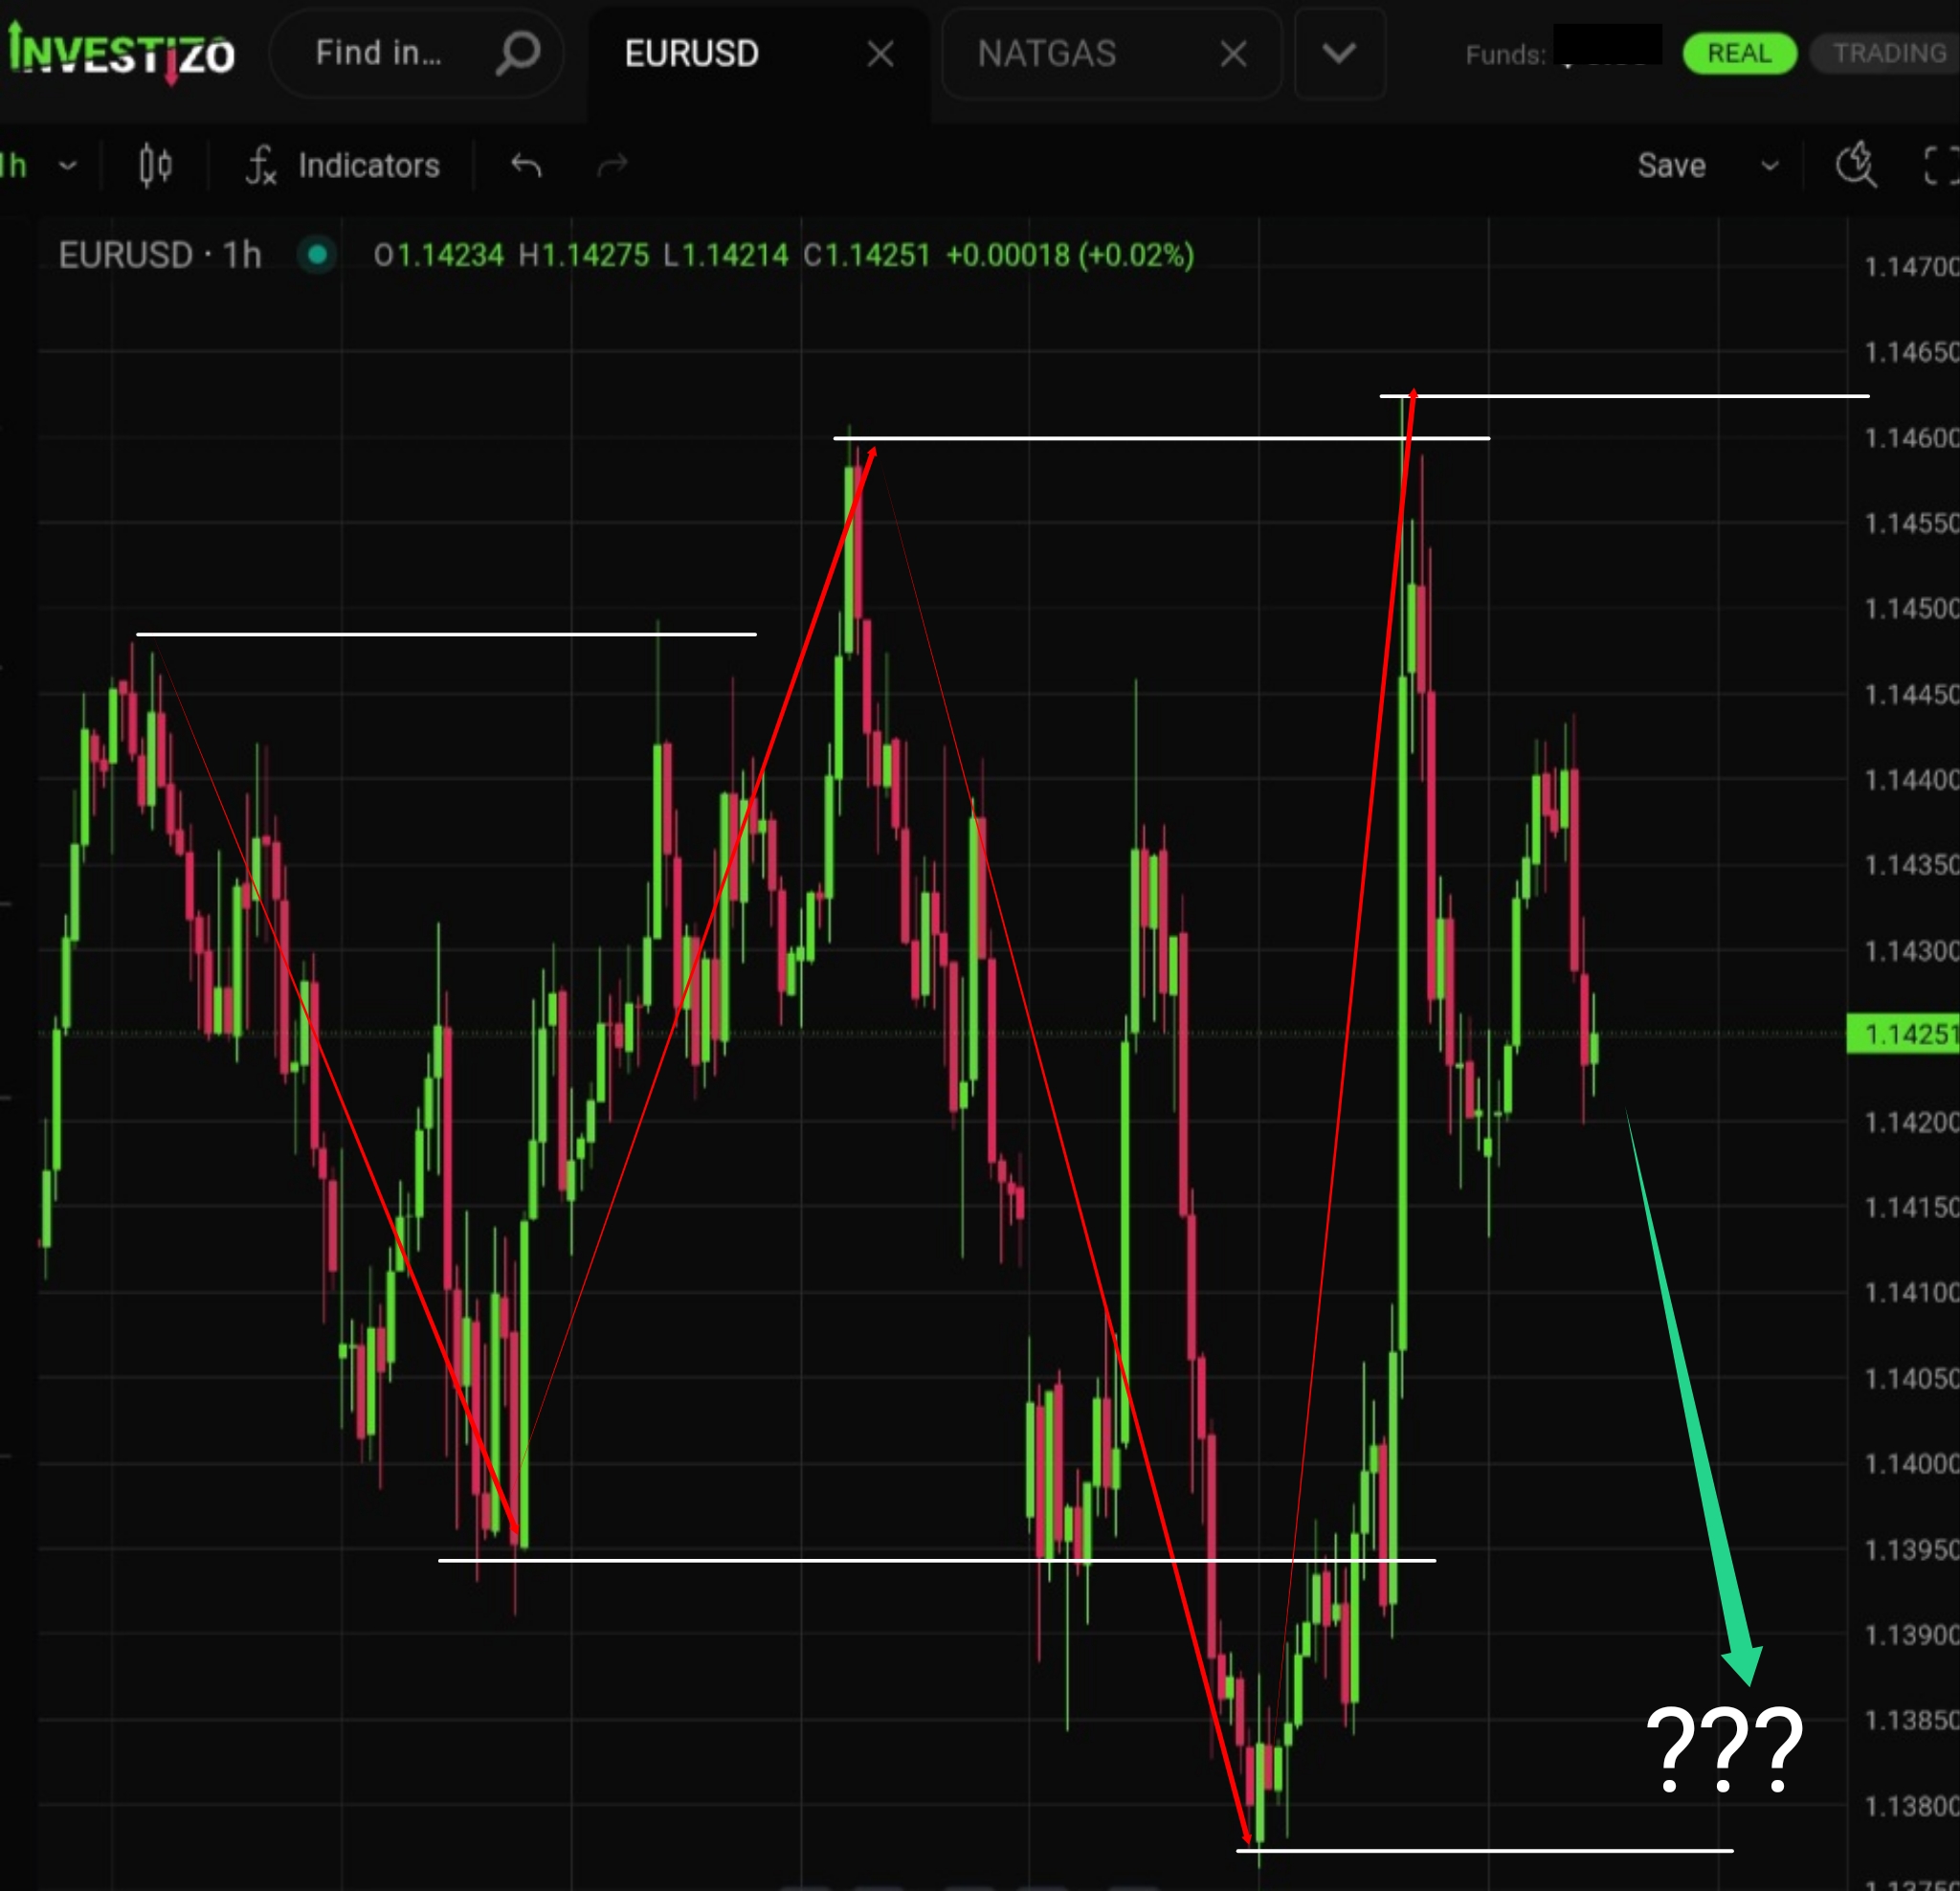
Bulls failed to update the upper structural high, shifting the market into either a consolidation phase.
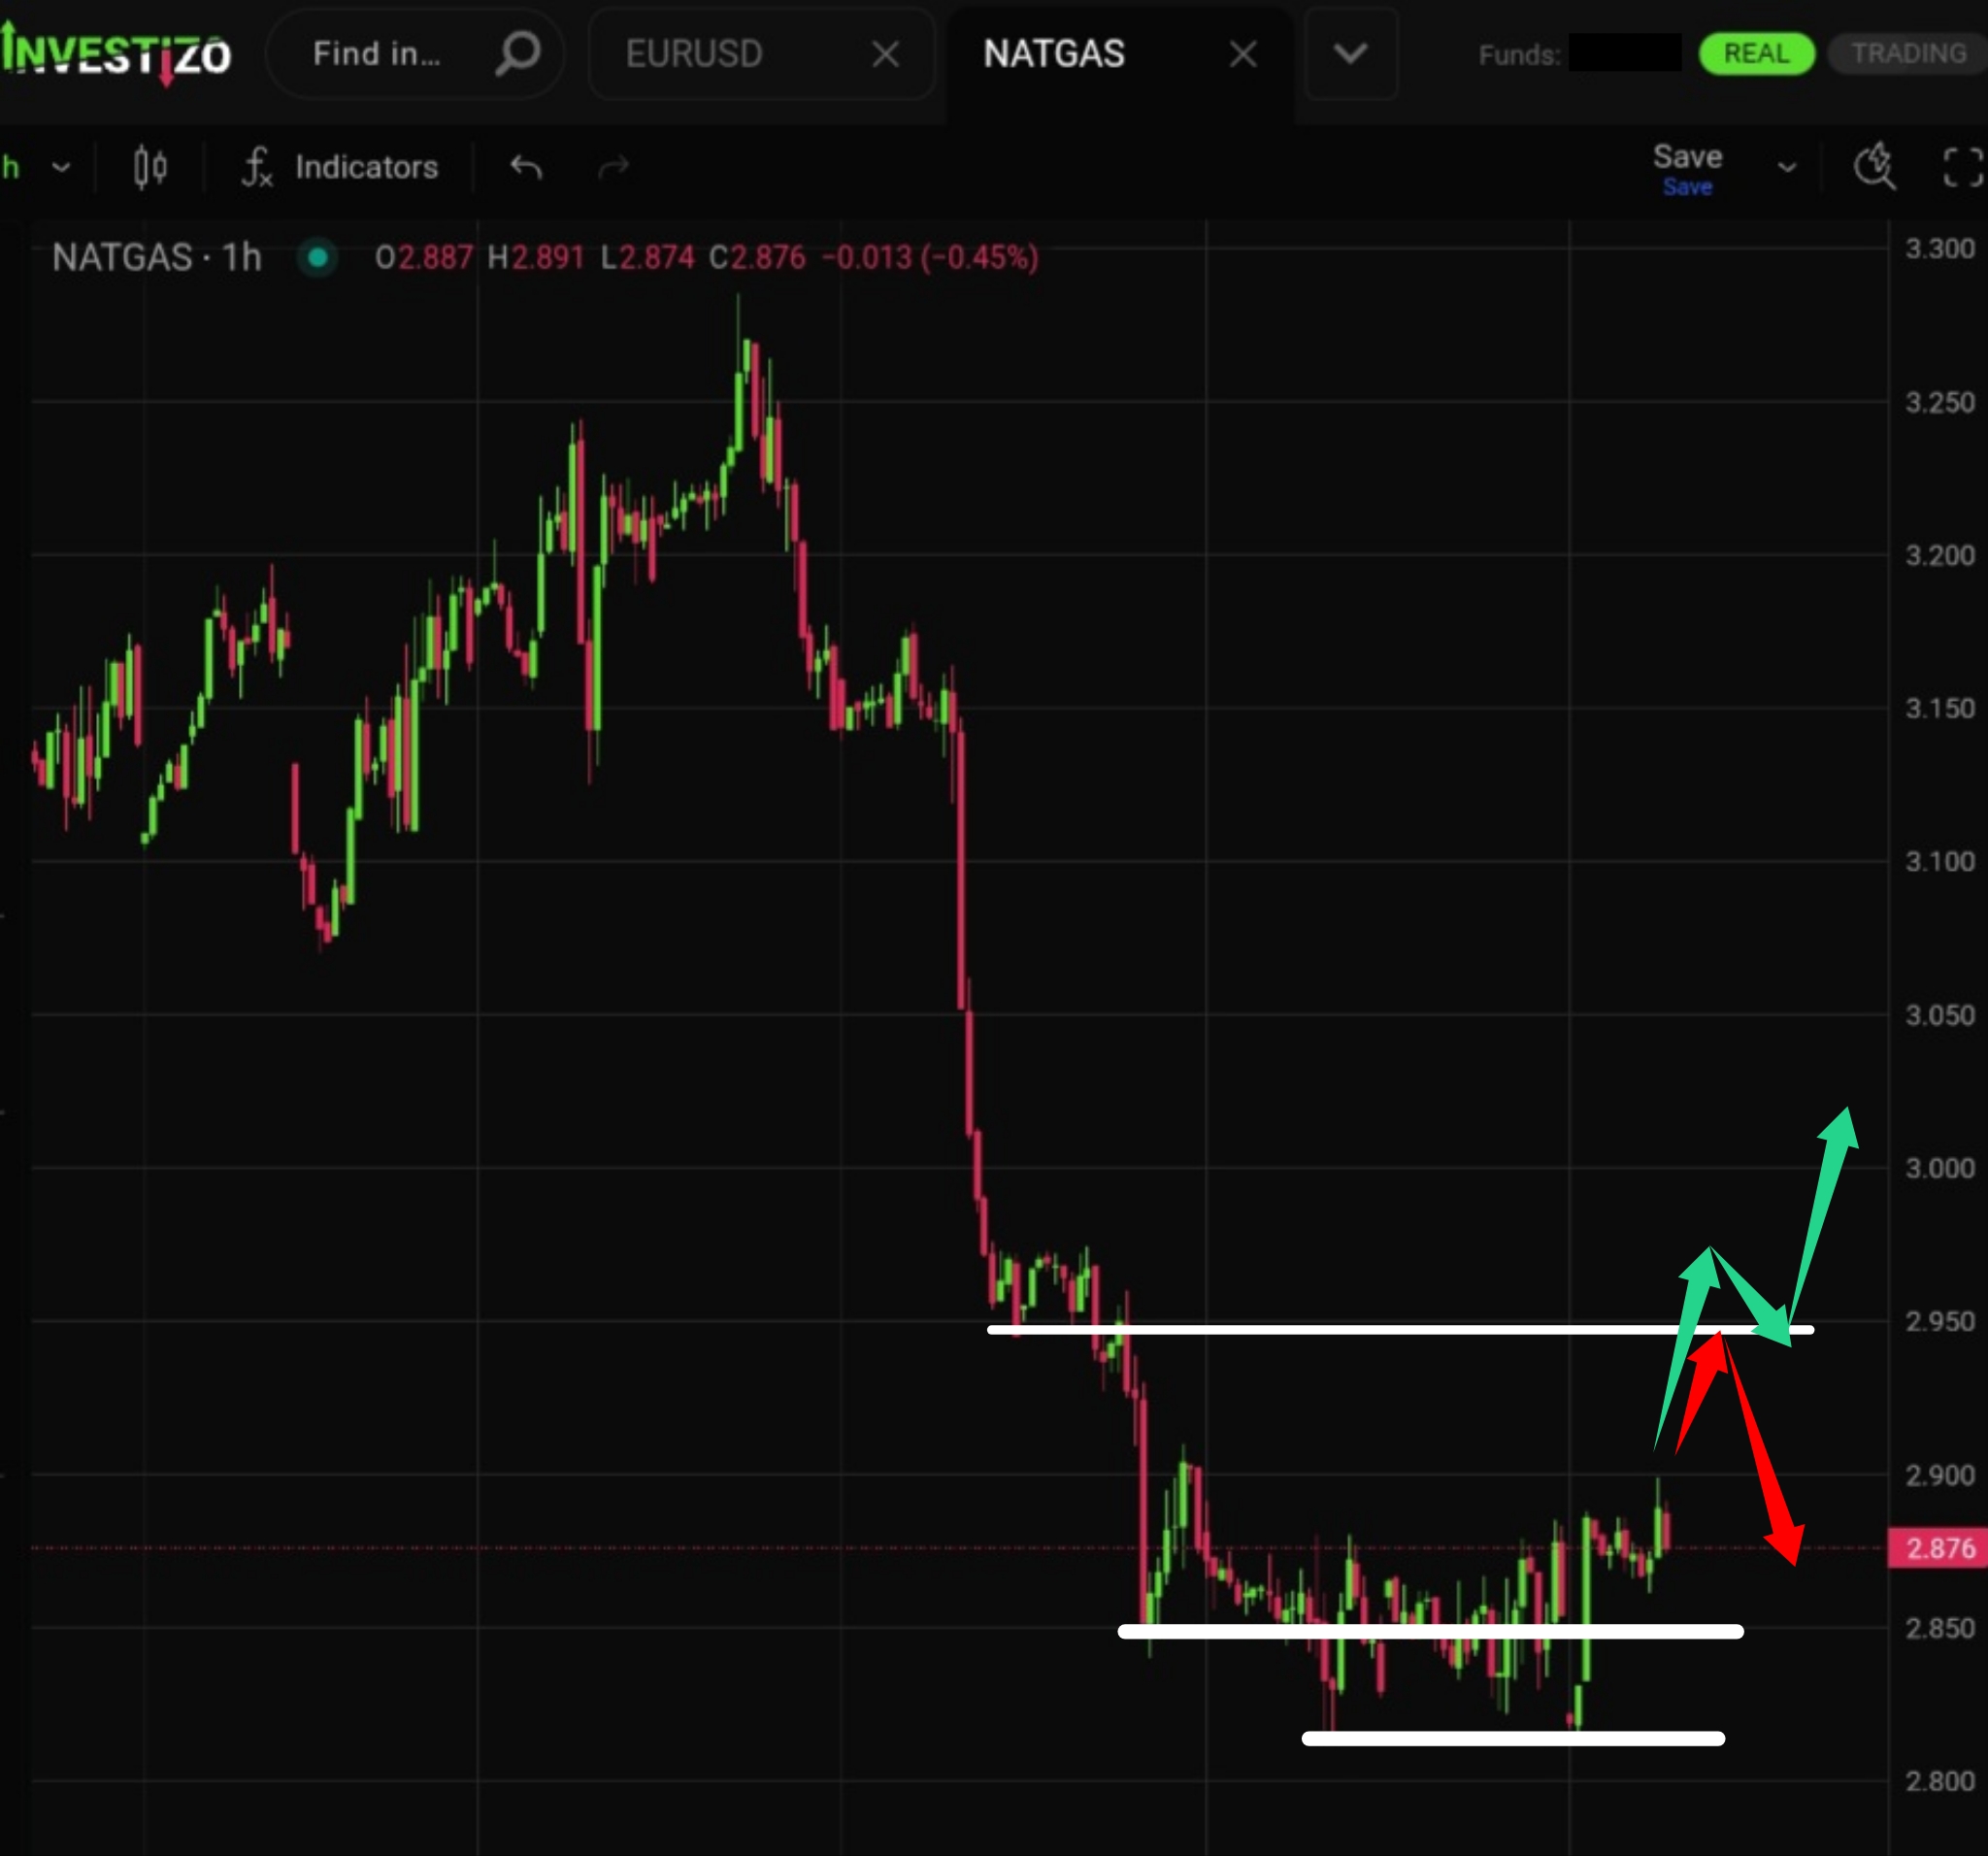
Natural gas is forming a “double bottom” pattern, which could serve as the foundation for a more significant reversal formation (such as an inverted Head and Shoulders).
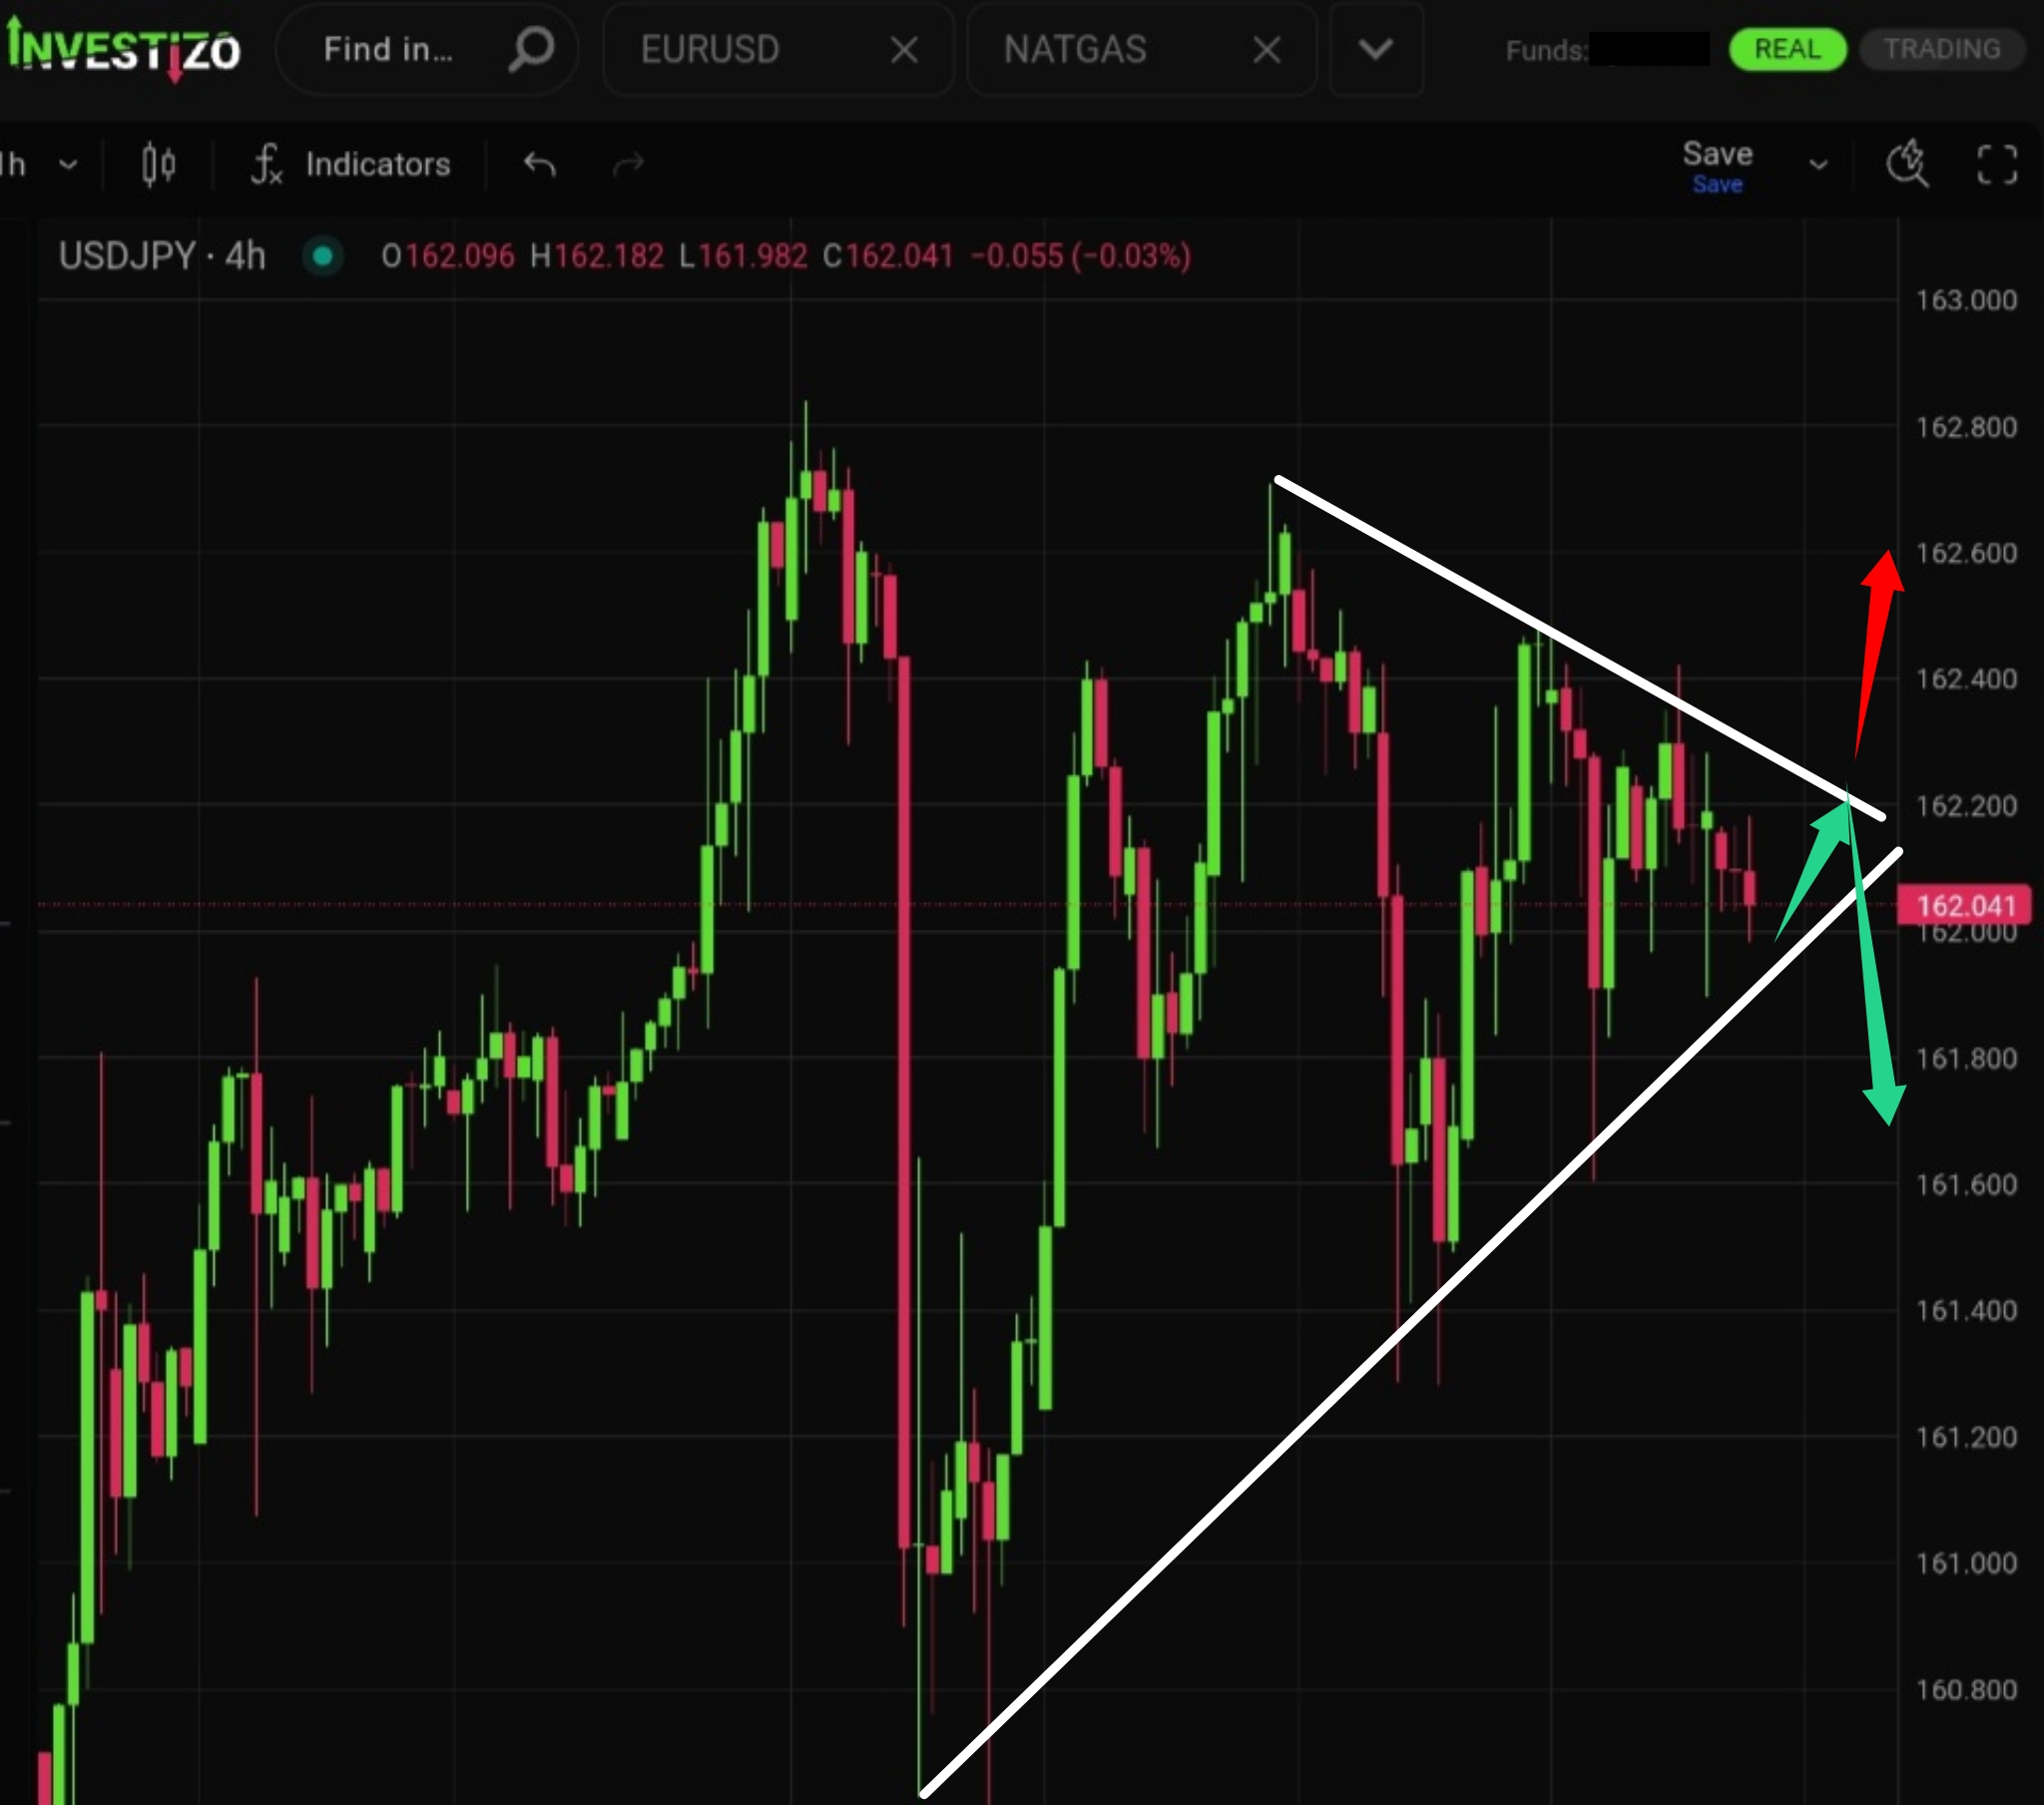
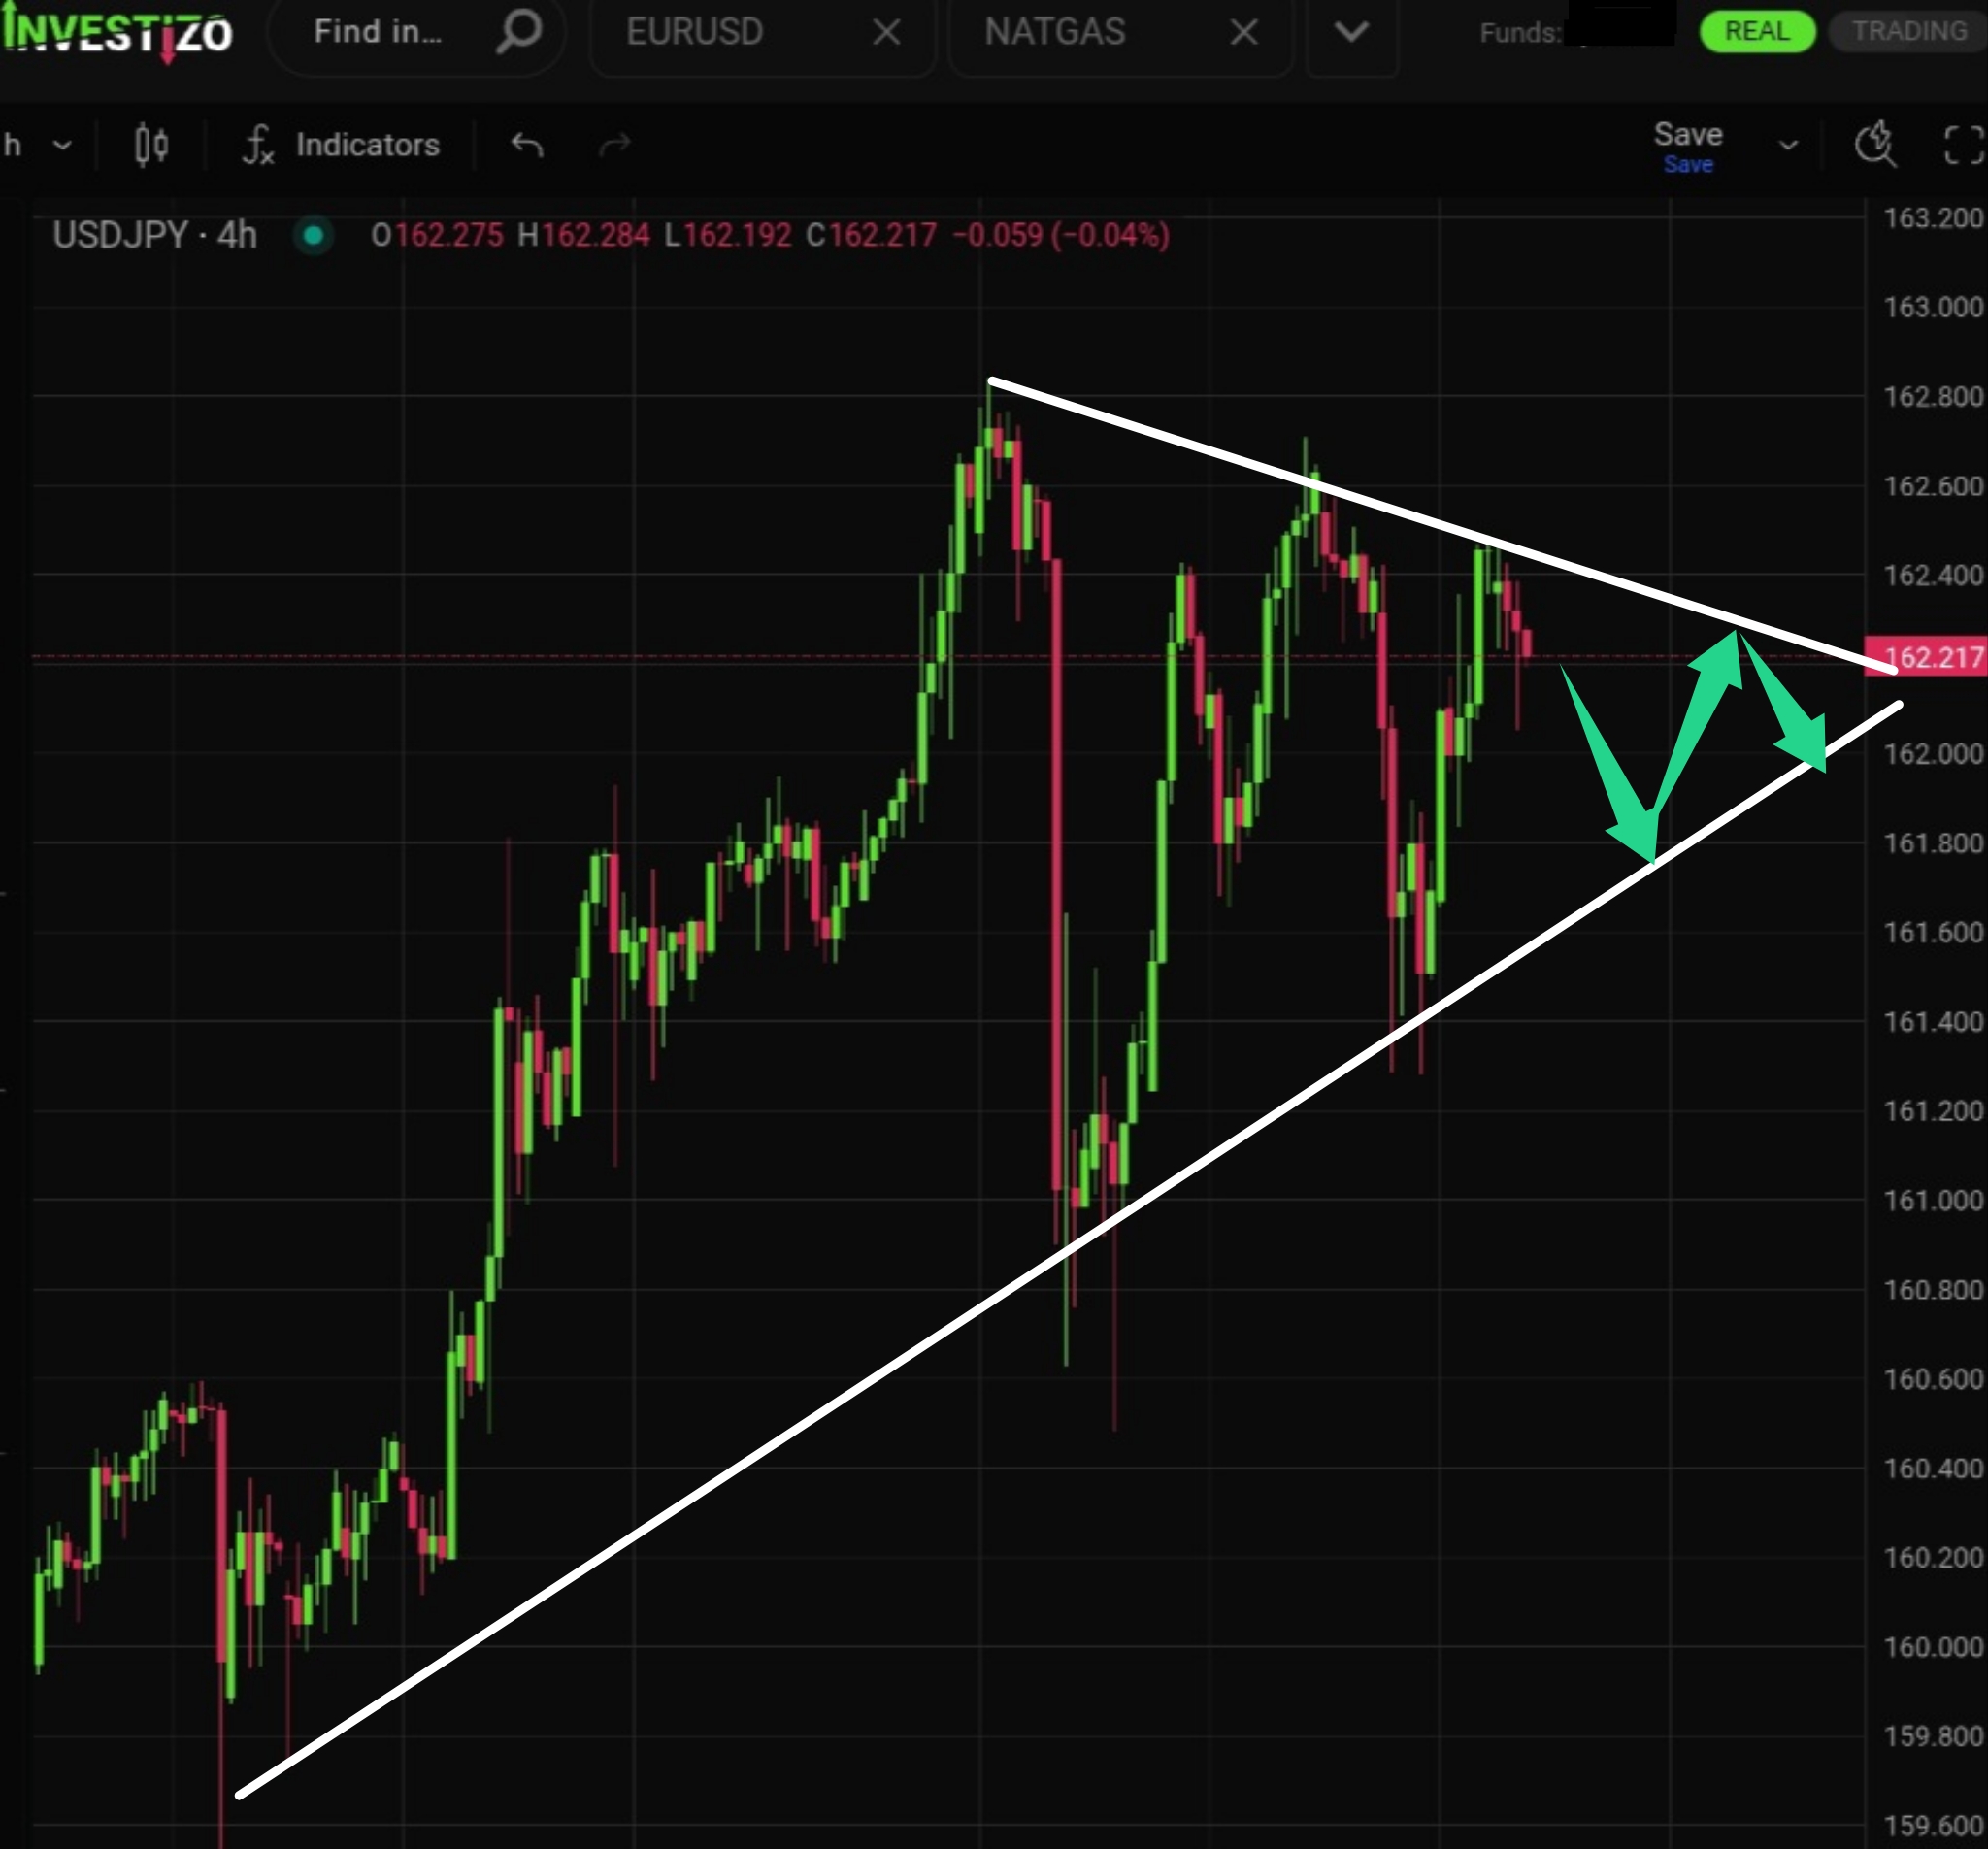
The pair continues to consolidate inside a narrowing triangular pattern between 162,000 and 162,400. It is likely to remain within this range.
Bitcoin (BTC/USD) trades at 64,806 this Wednesday morning, staging a powerful breakout from its two-week consolidation phase.
Technically, the pair is not in a clear trend. It continues to update structural extremes with each price swing.
Brent Crude trades at 85.10 this Wednesday morning, sustaining its break above the psychological 85.00 threshold for the first time in a month.
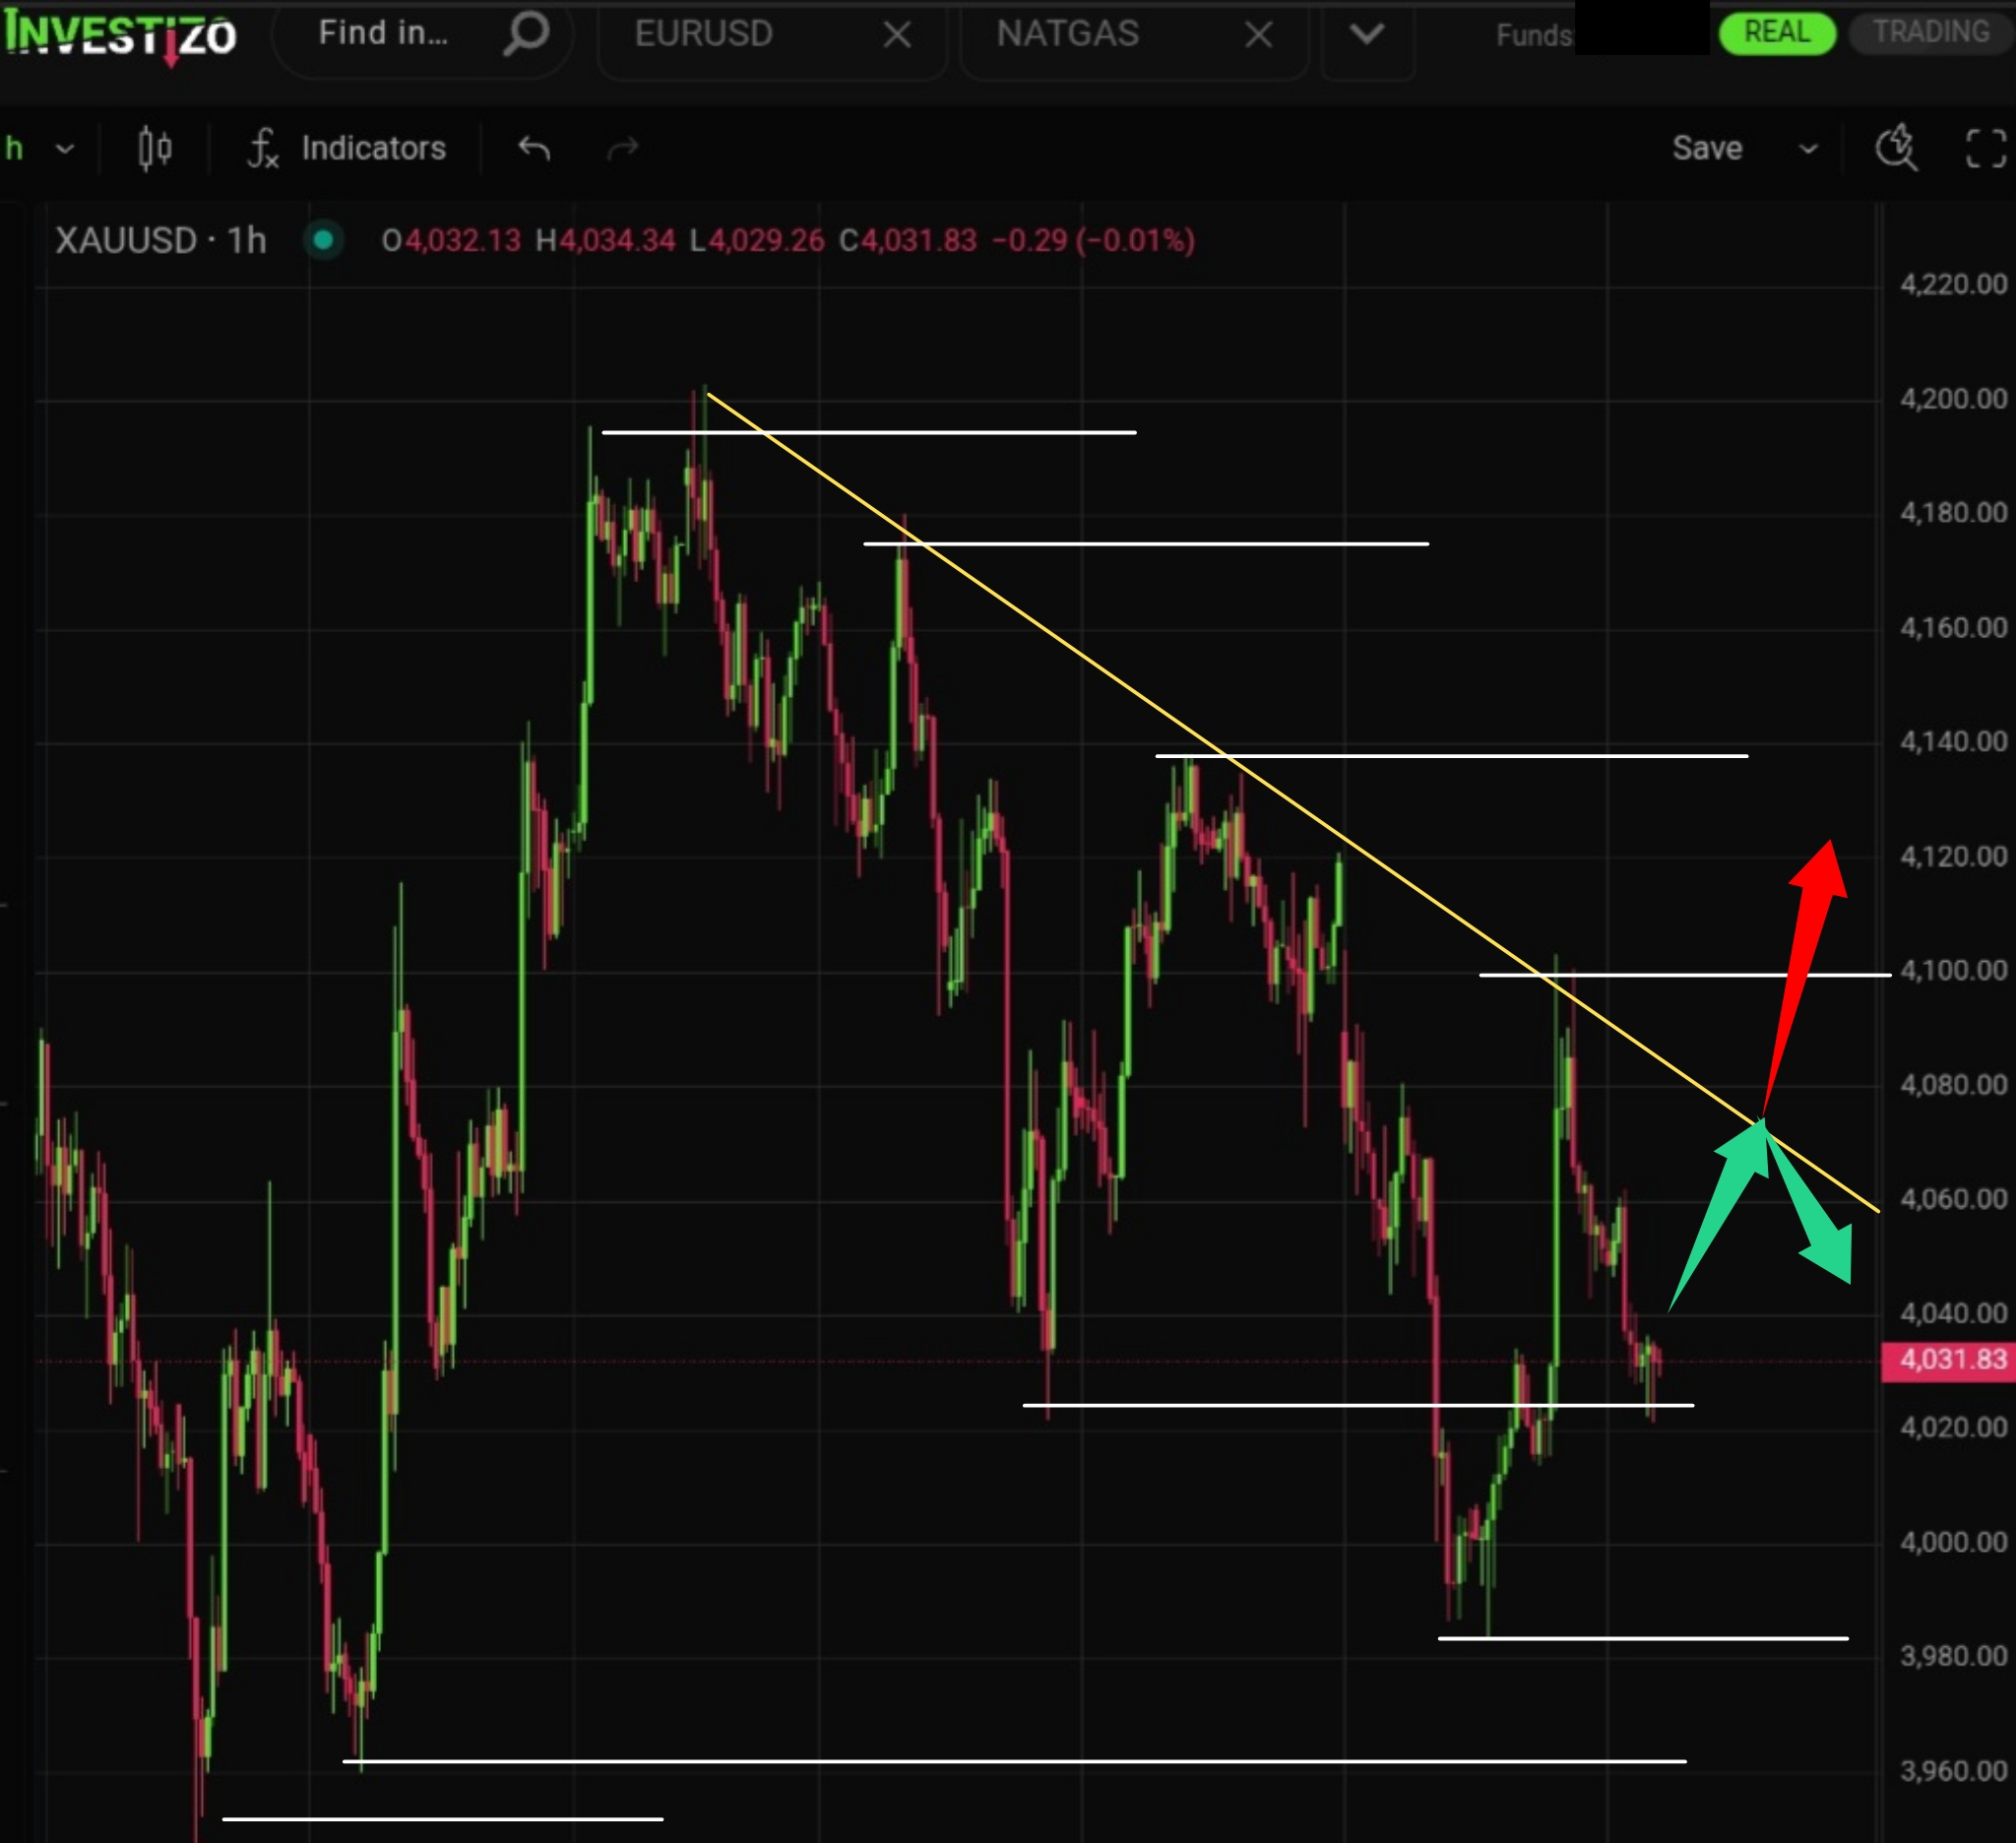
Gold has likely completed its medium-term downtrend.
The pair continues to consolidate inside a narrowing triangular range between 161.800 and 162.400.