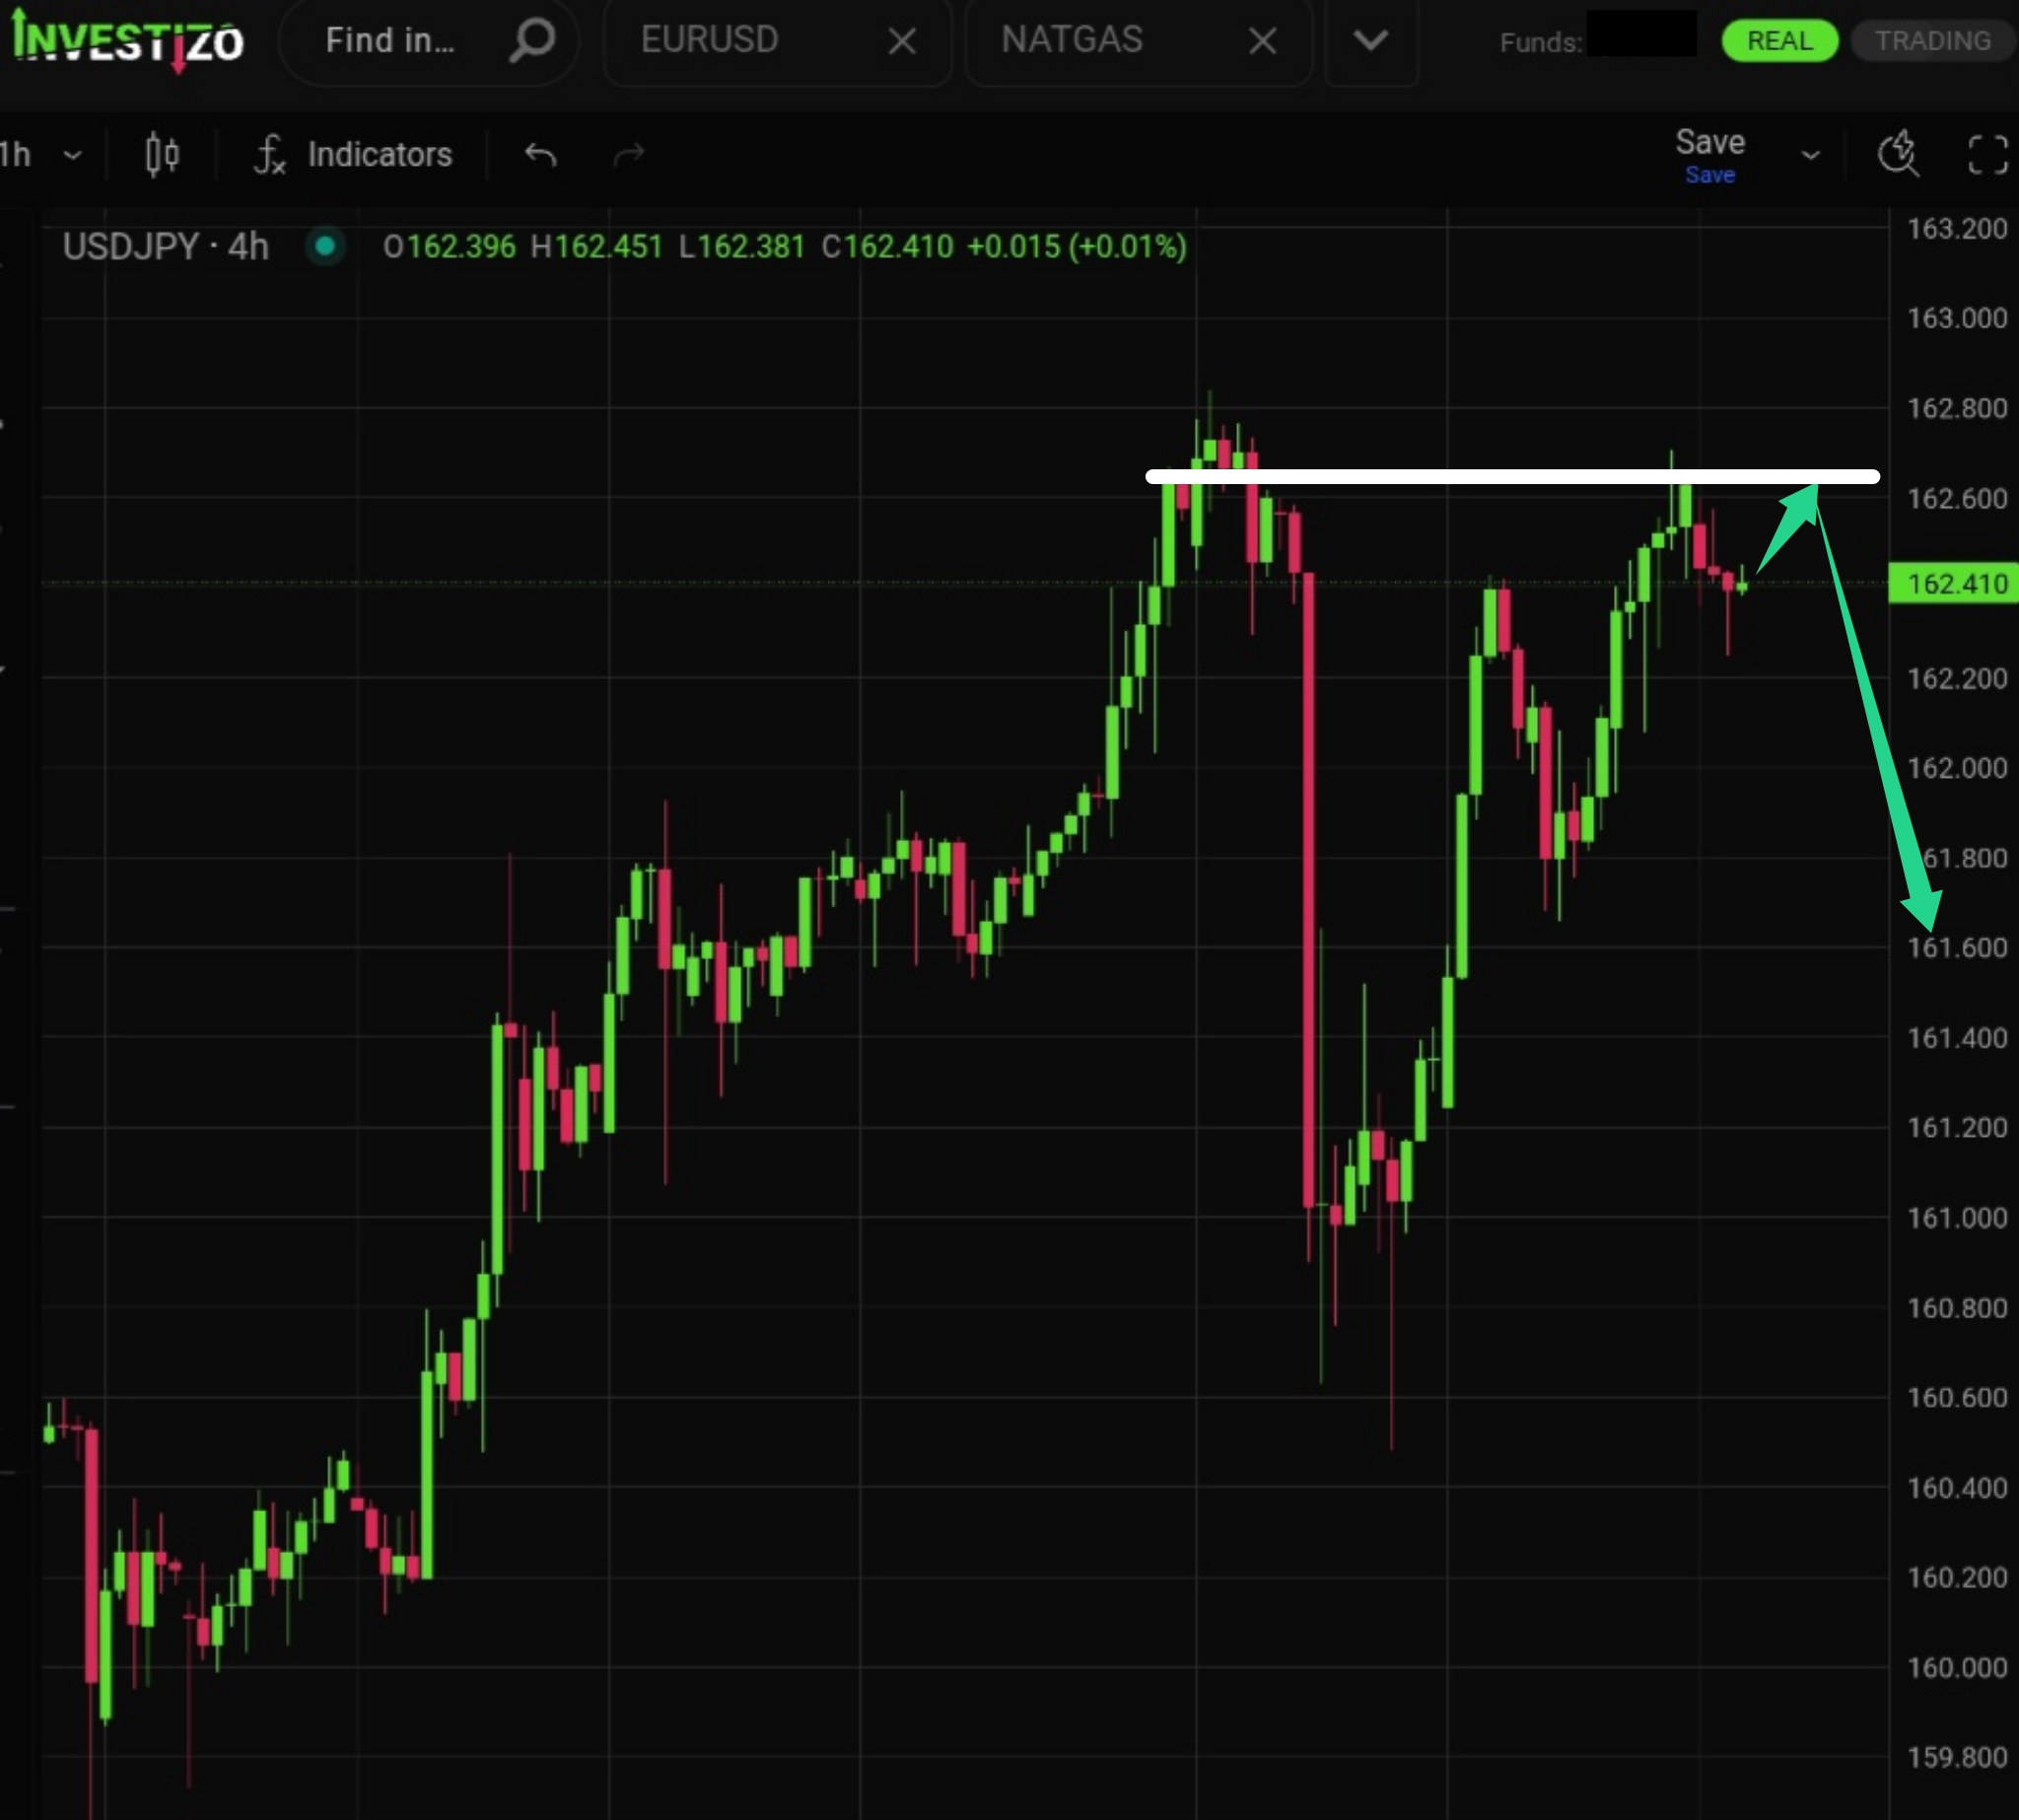
USD/JPY, Technical Analysis – H4
USD/JPY remains under bearish pressure after confirming its downside scenario, with the focus shifting to lower support levels following a brief corrective rebound.
Investizo LTD. Business company number 25432 BC 2019
Suite 305, Griffith Corporate Centre,
P.O. Box 1510, Beachmont, Kingstown,
St. Vincent and the Grenadines
DUNS 817053497
Phone:+996312610515
E-mail: [email protected]
© 2019-2026 Investizo 18+ Все права защищены
Предупреждение о рисках: CFD являются сложными финансовыми продуктами, торгуемыми на марже. Торговля CFD рискованна и может не подходить для всех инвесторов. Убедитесь, что вы понимаете риски, связанные с тем, что вы можете потерять весь свой инвестированный капитал.
USD/JPY remains under bearish pressure after confirming its downside scenario, with the focus shifting to lower support levels following a brief corrective rebound.
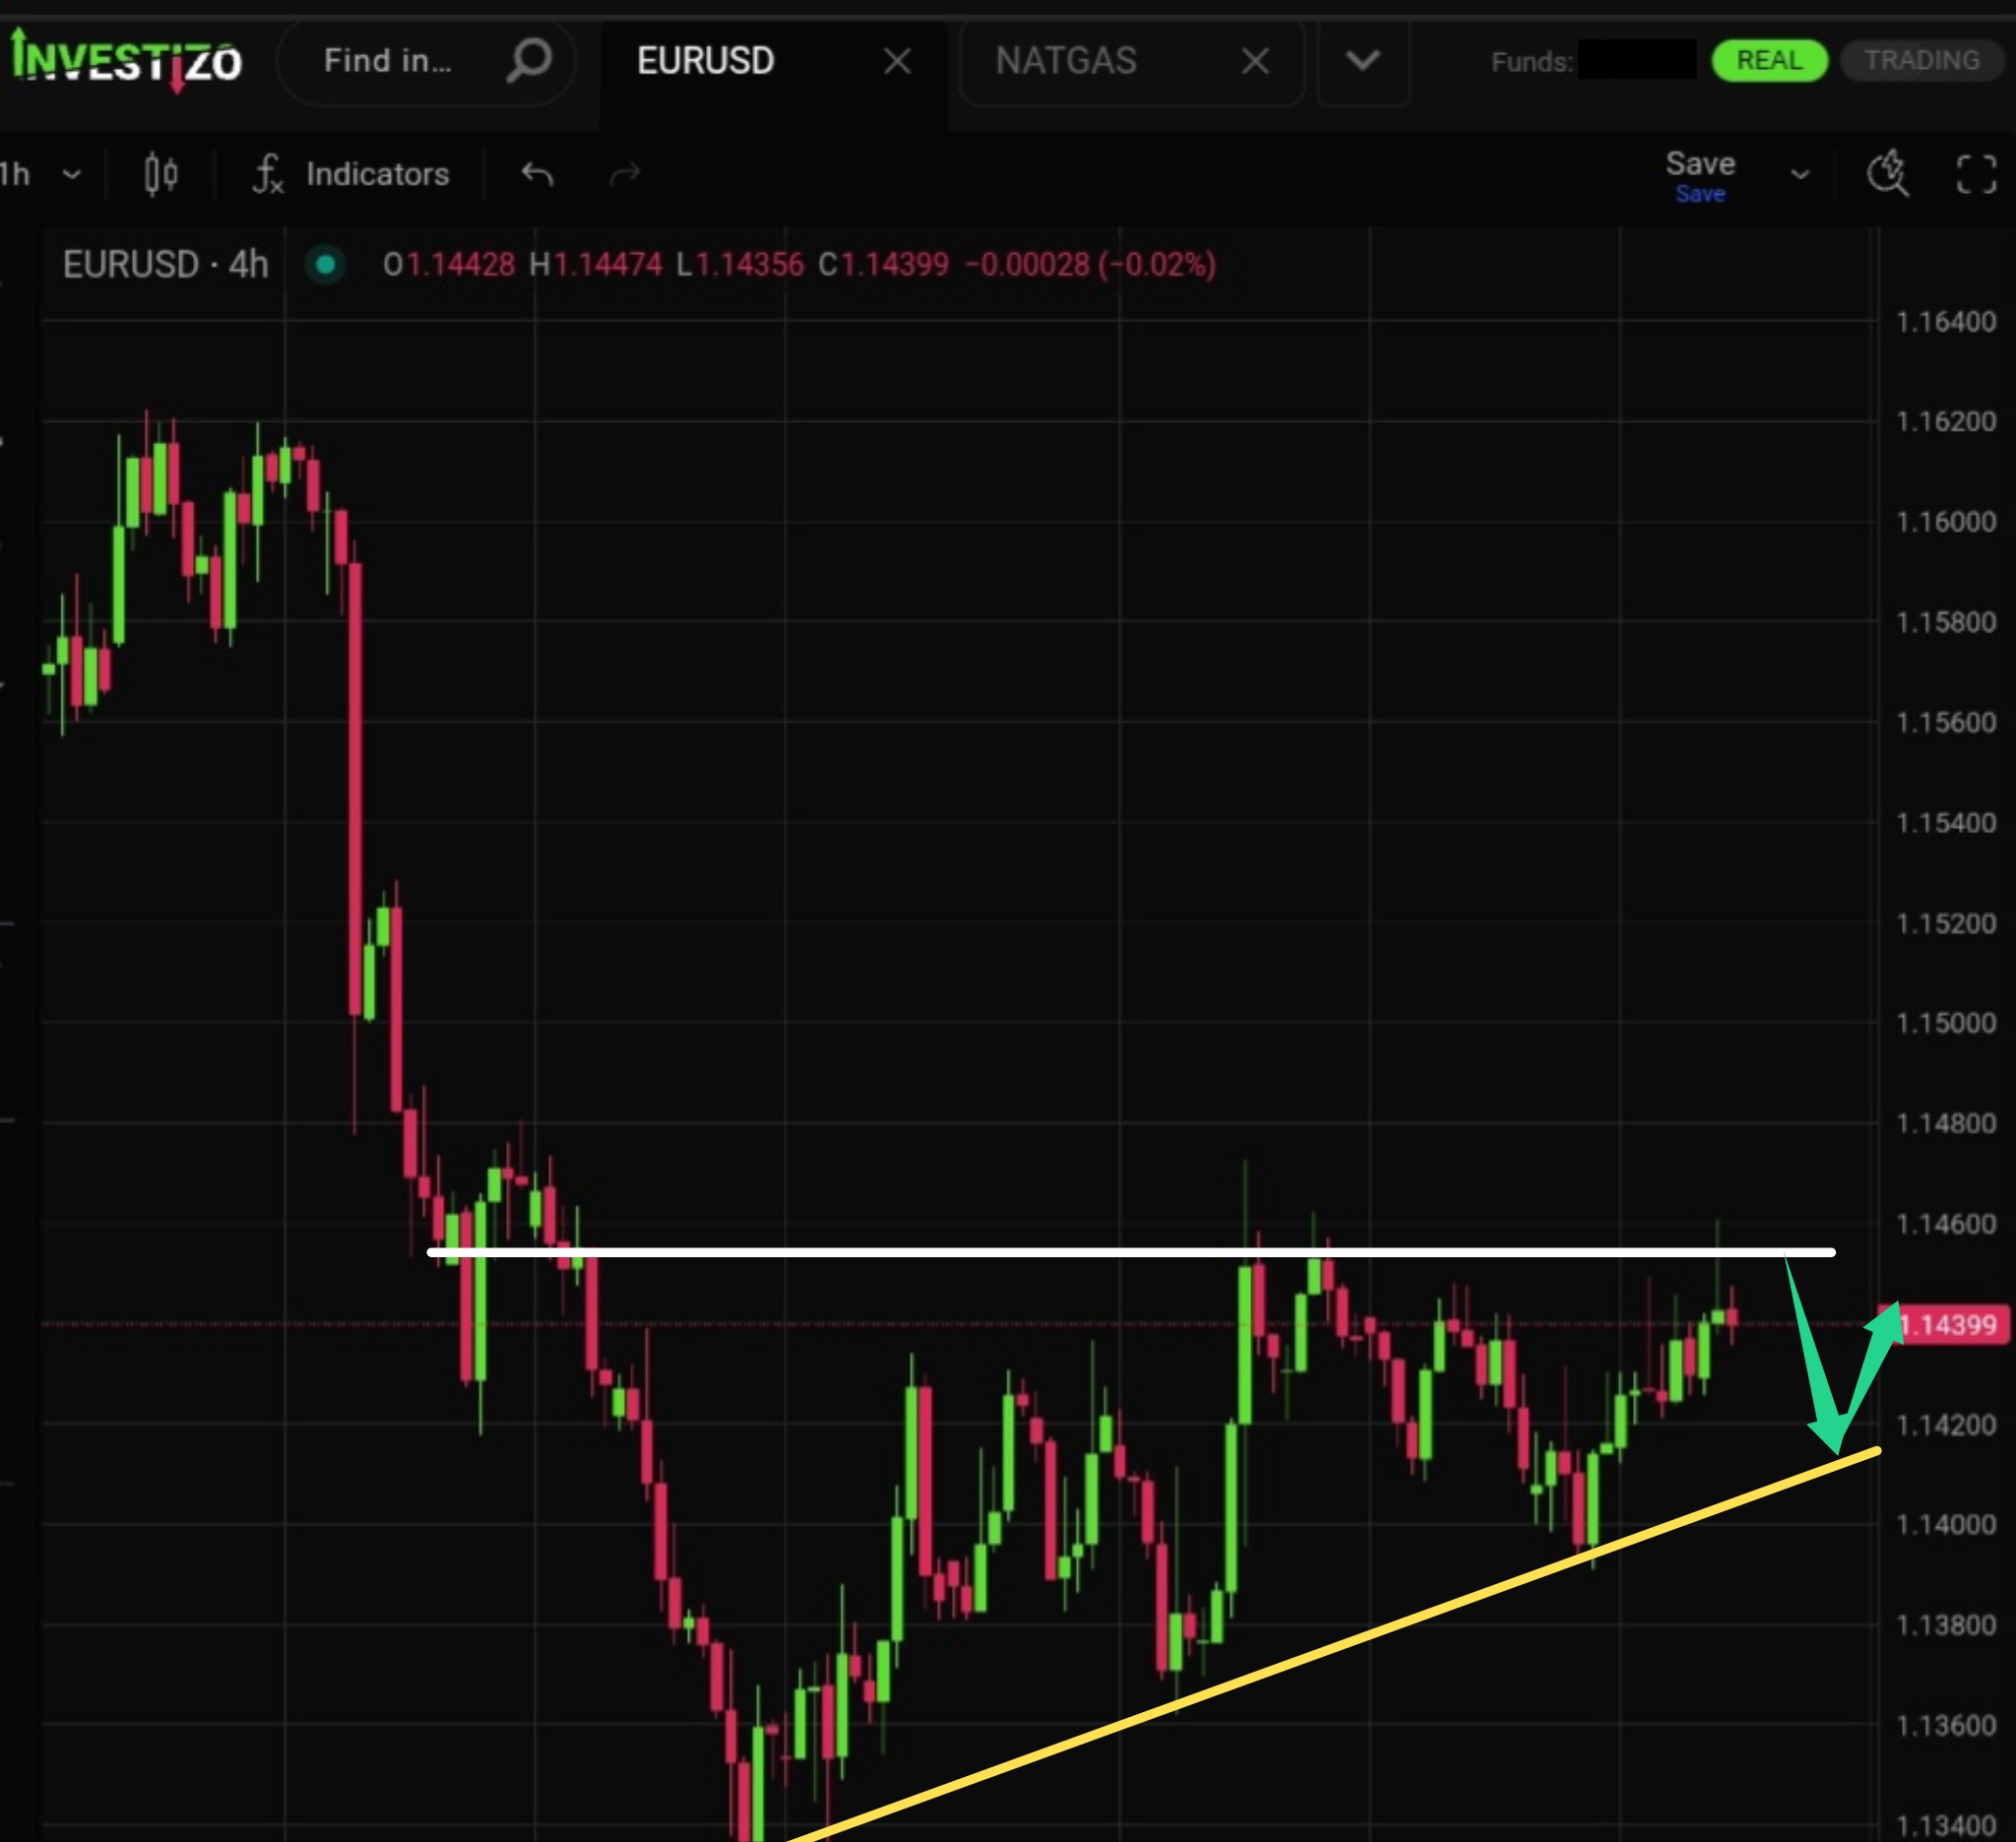
EUR/USD is trading within a well-defined 50-pip range as market participants avoid taking aggressive positions ahead of the weekend.
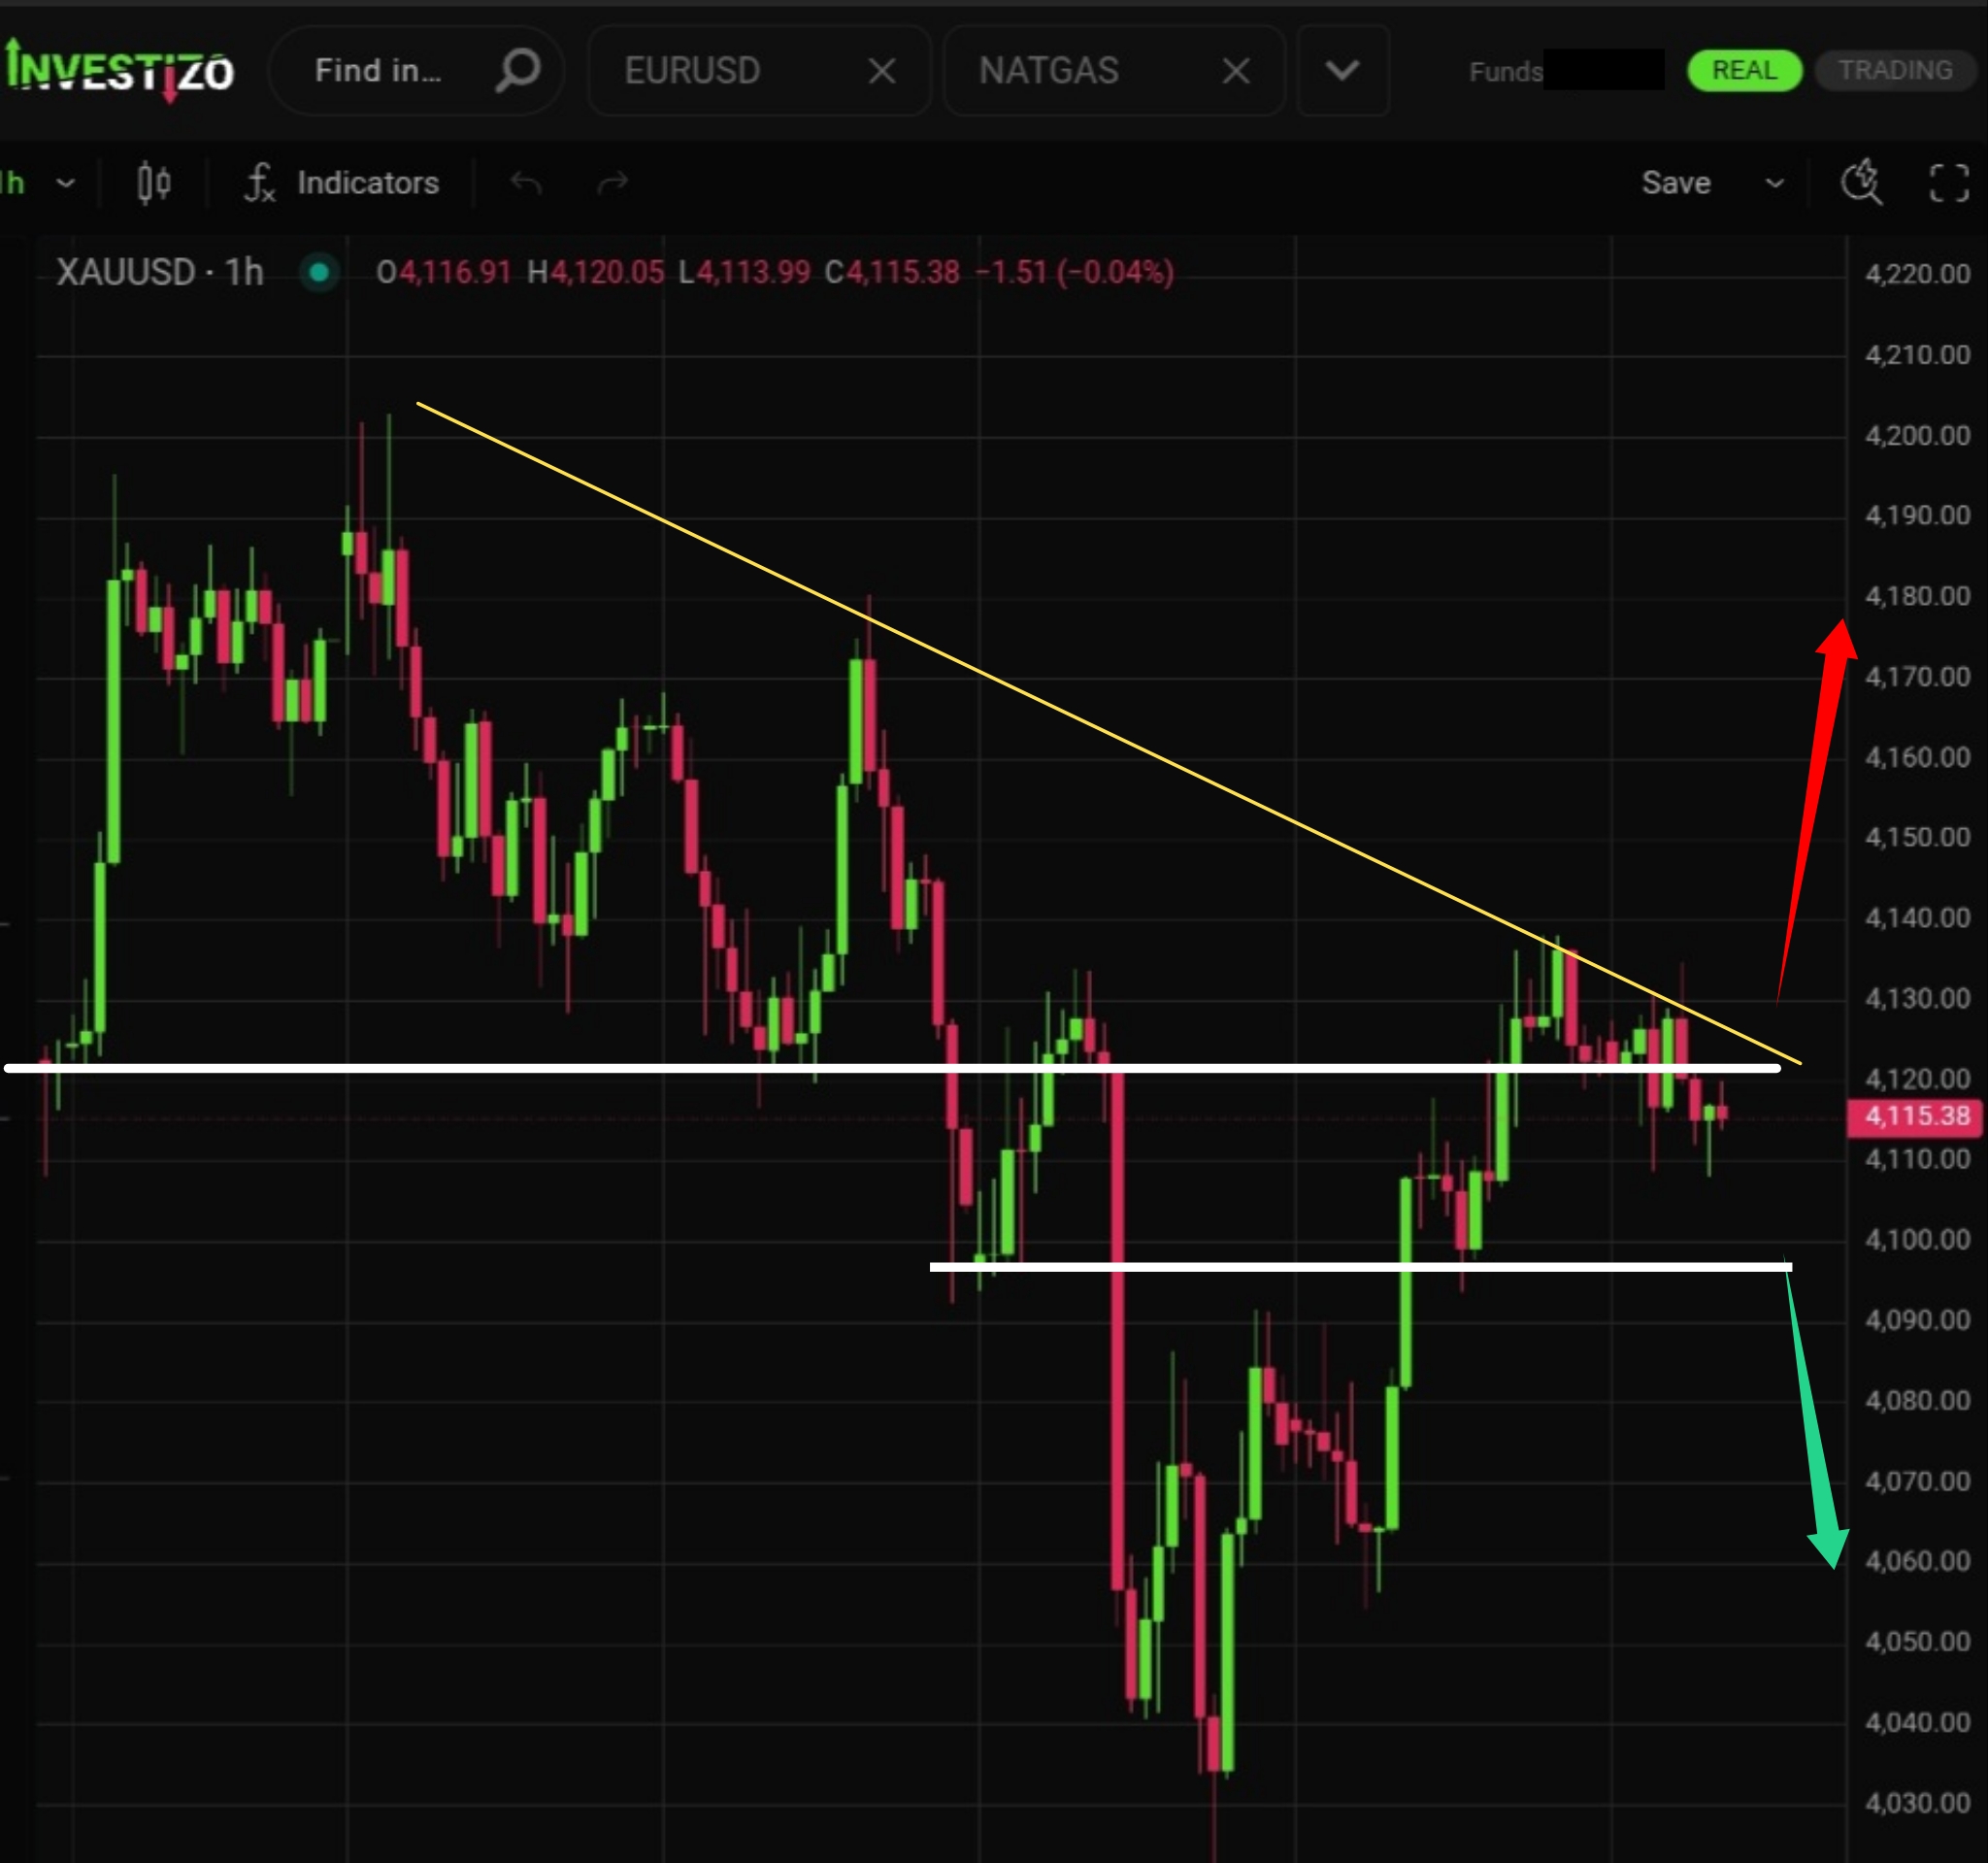
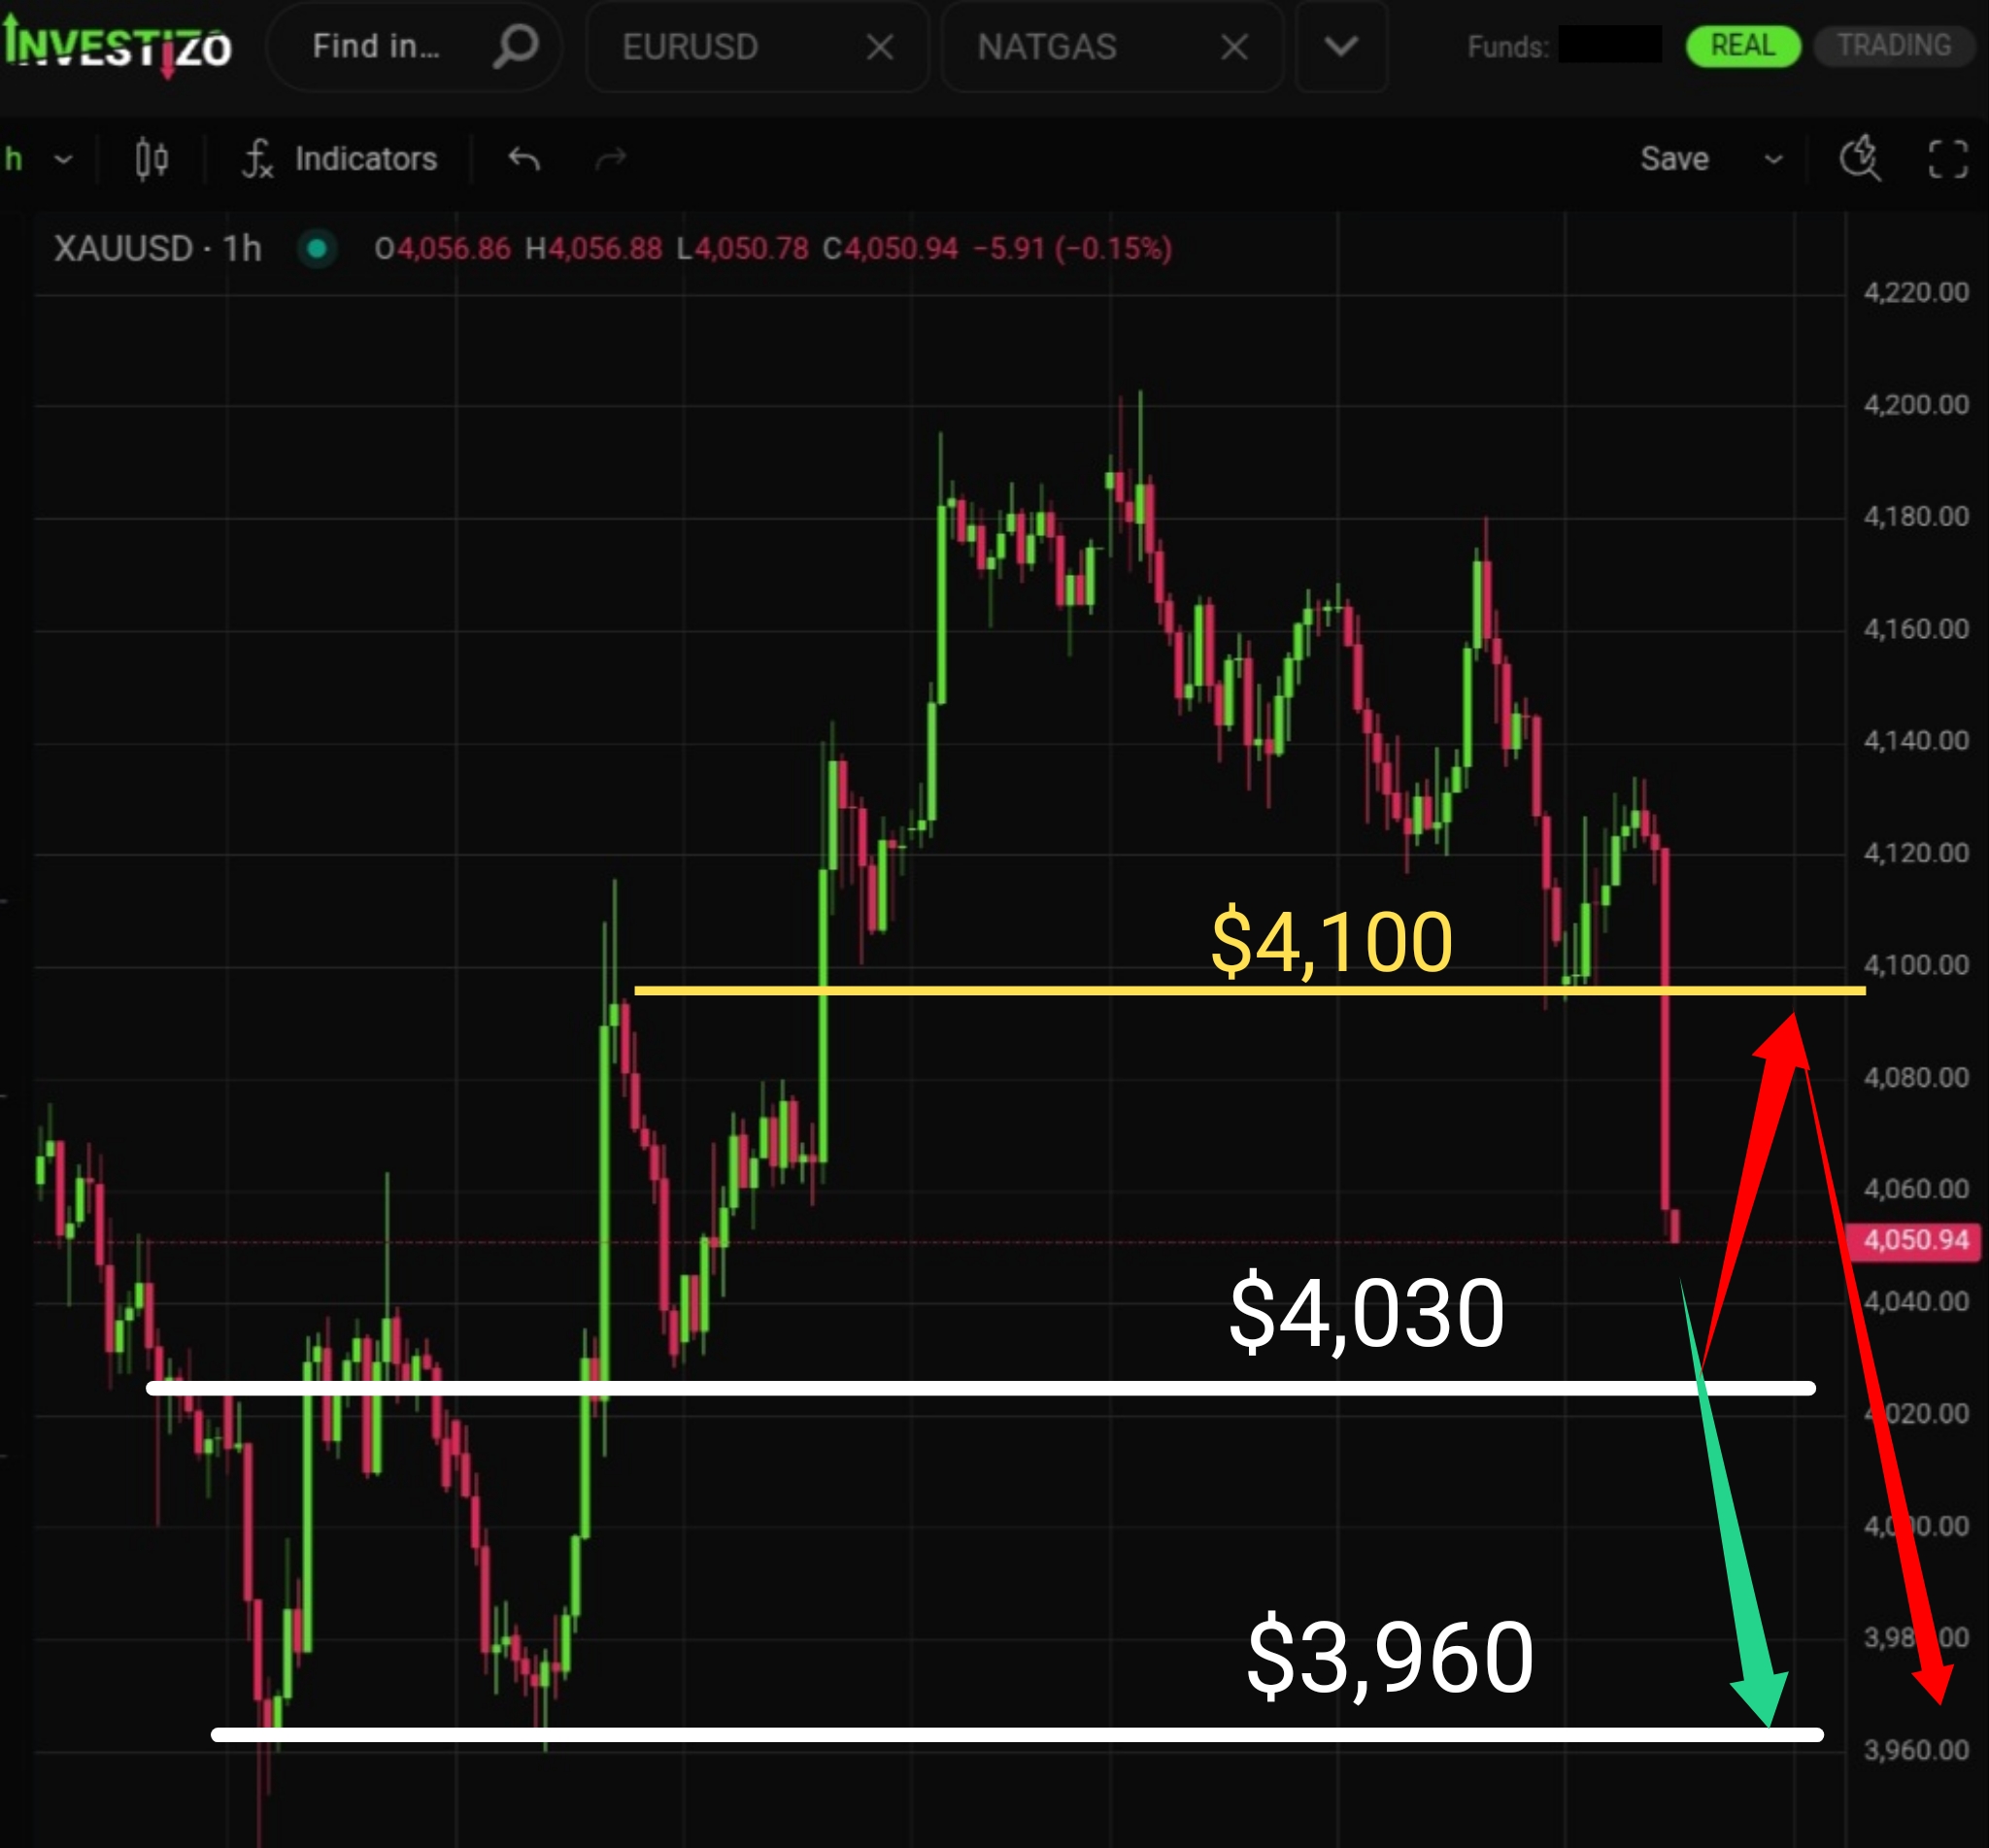
Gold remains under pressure near $4,115 as stronger US economic data and hawkish Federal Reserve expectations outweigh safe-haven demand.
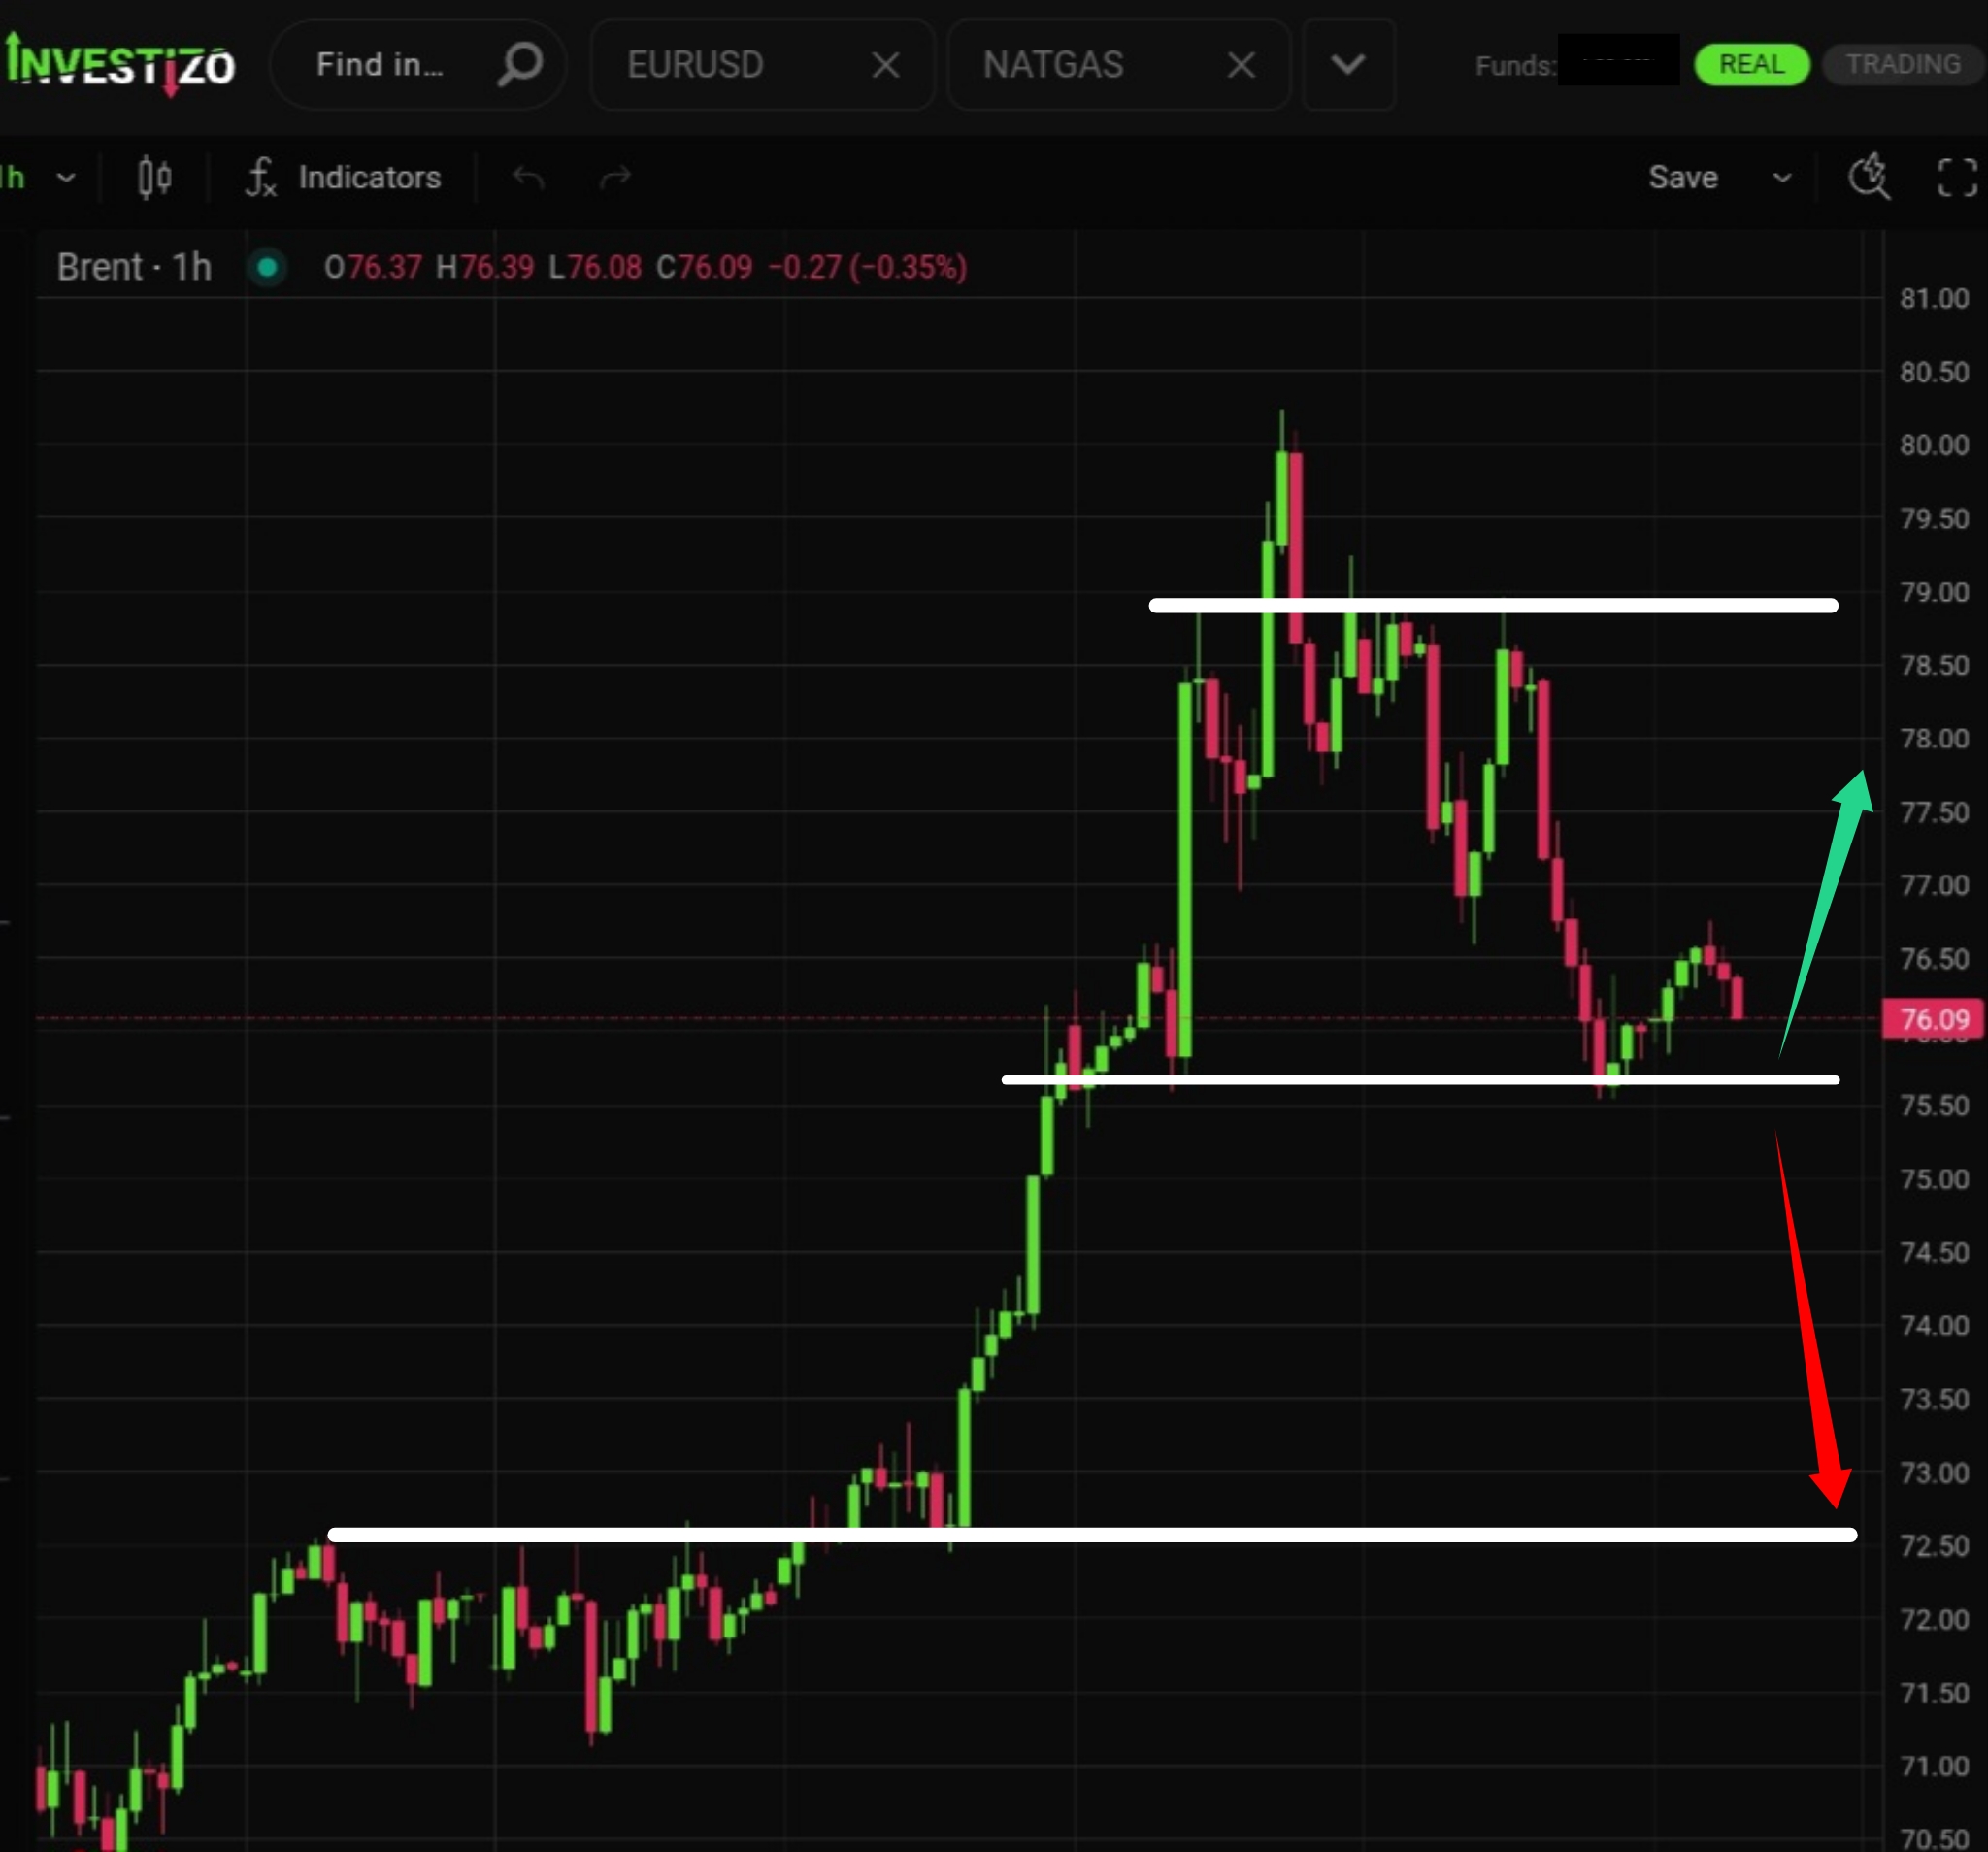
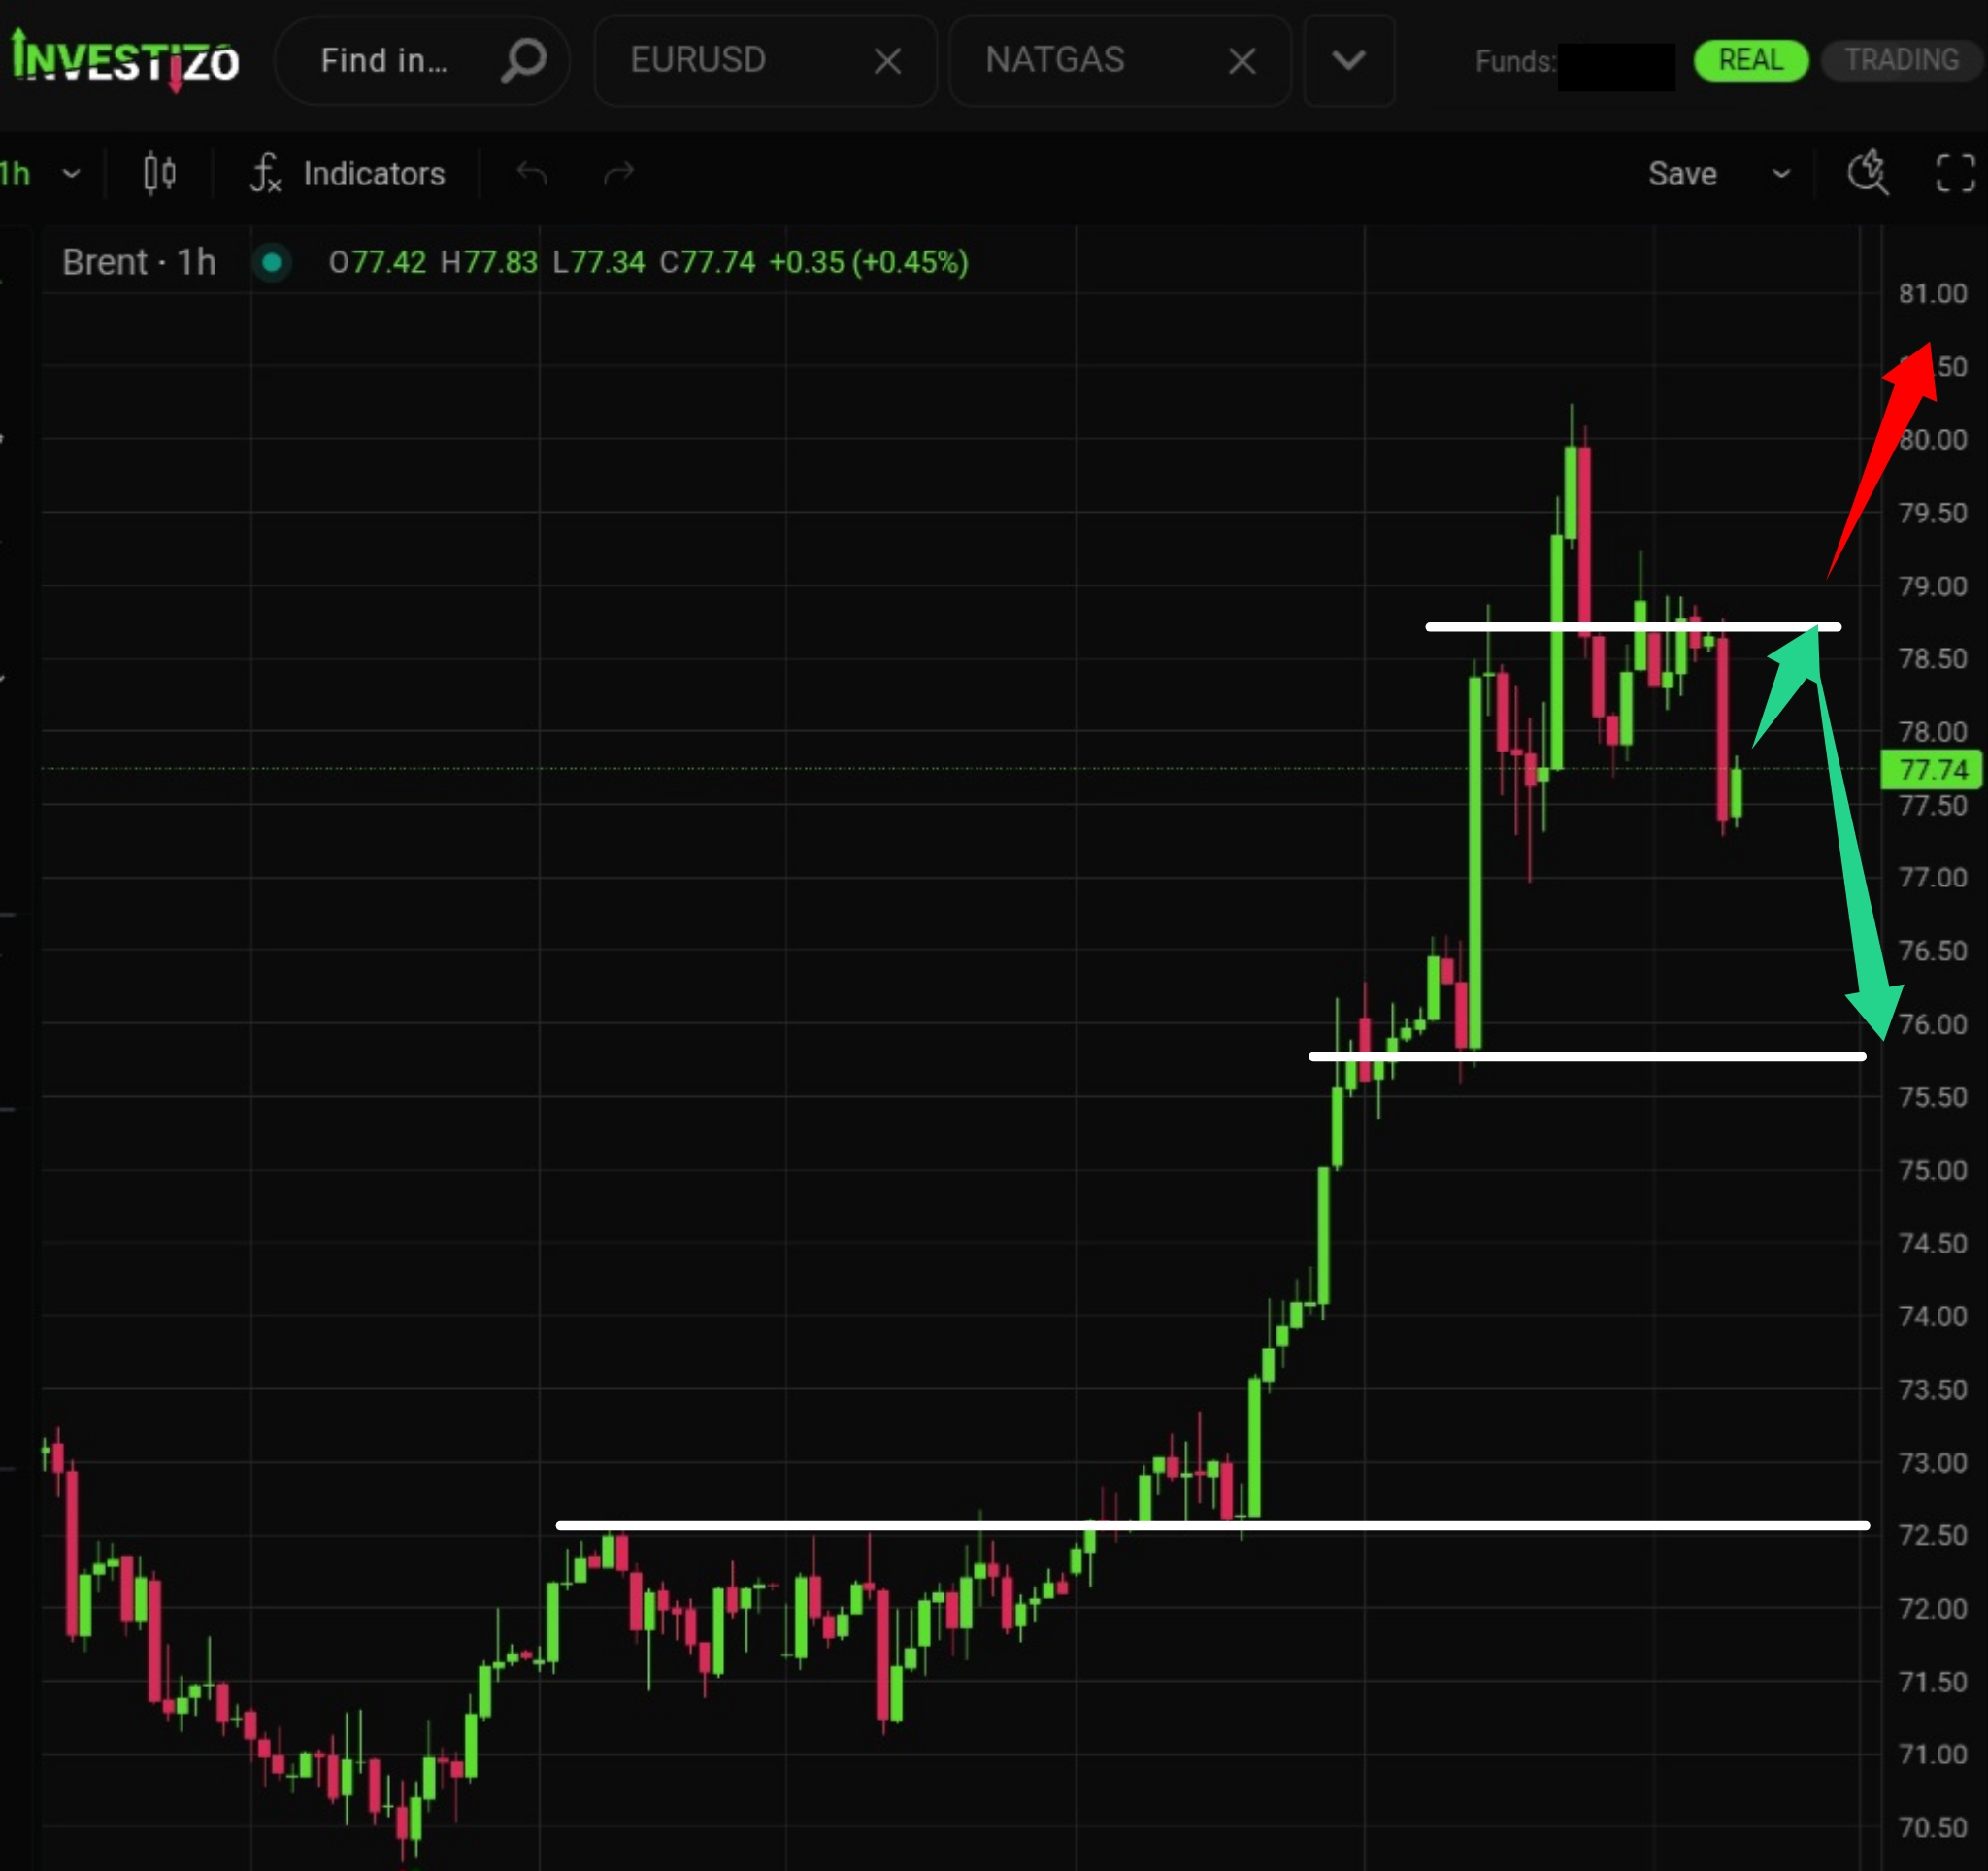
Brent crude is holding near $76 as markets weigh severe supply risks in the Strait of Hormuz against growing optimism over US-Iran diplomacy.
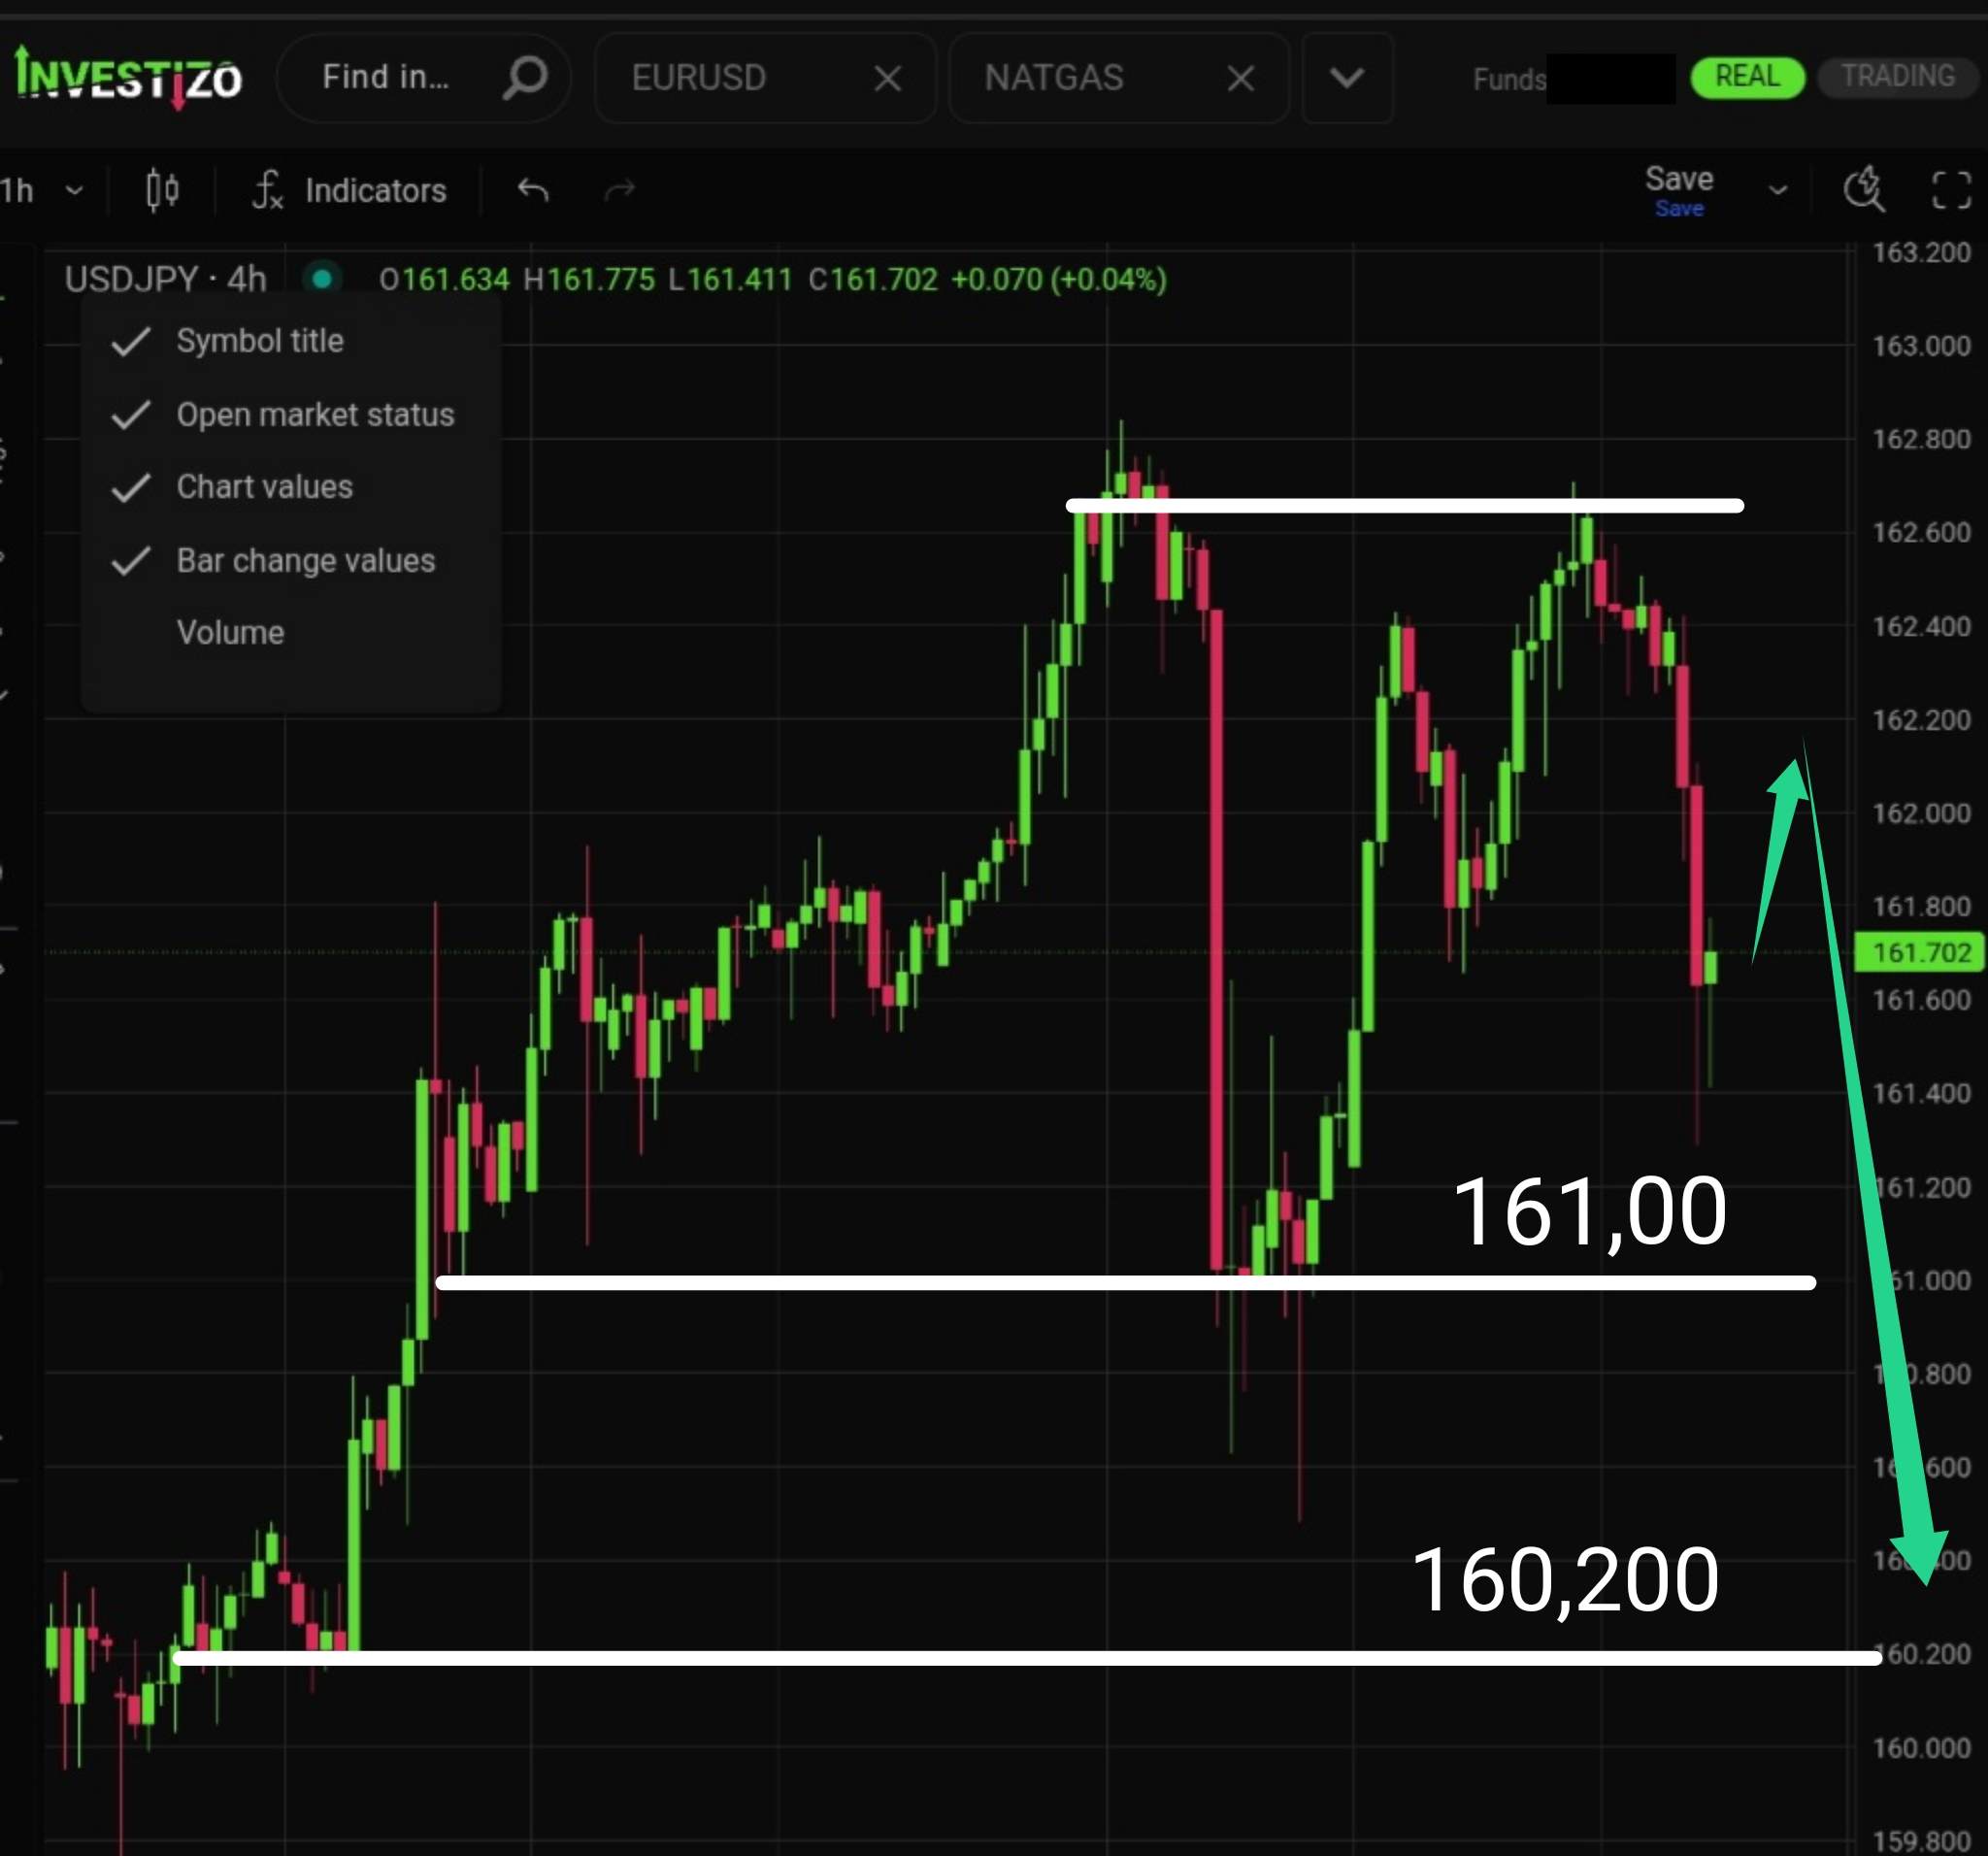
USD/JPY has tested the supply area near 162,700, marking the likely end of the recent correction. Bears are now poised to push the pair toward the next major downside target.
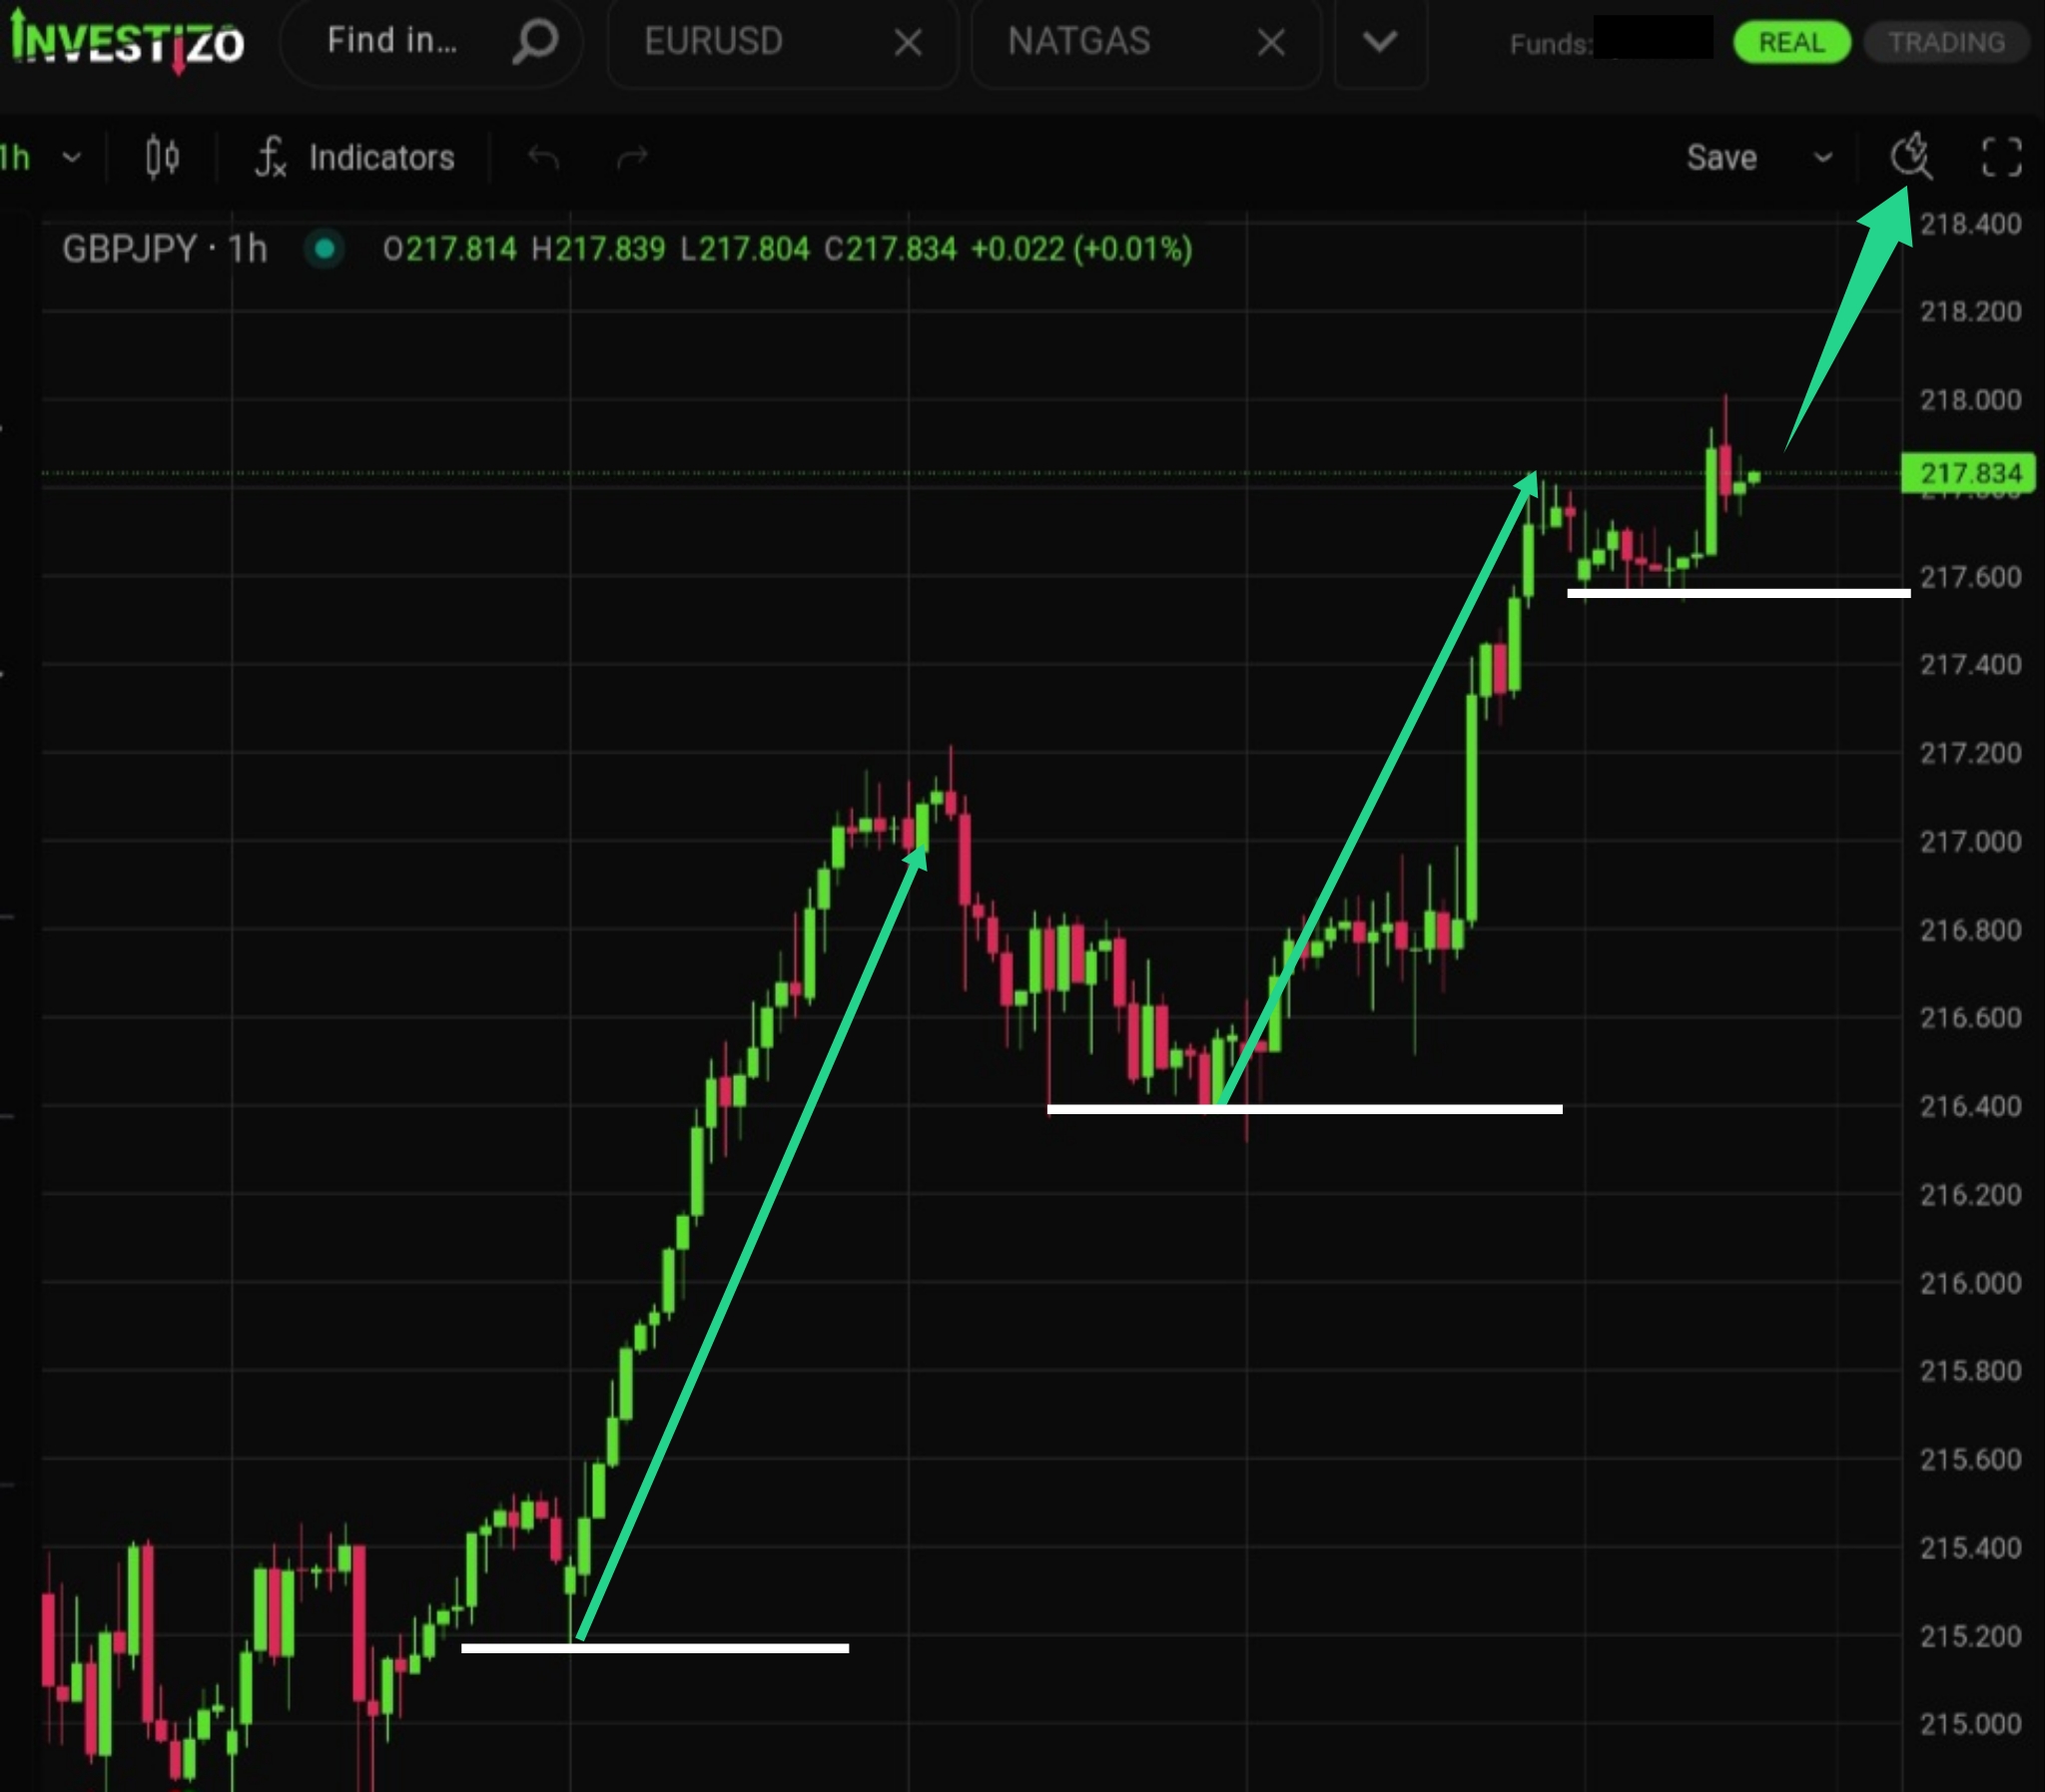
GBP/JPY continues its strong uptrend, developing classic “bull flag” patterns. Momentum is gradually slowing, suggesting that once the current leg reaches its target, a deeper corrective move may follow due to profit-taking.
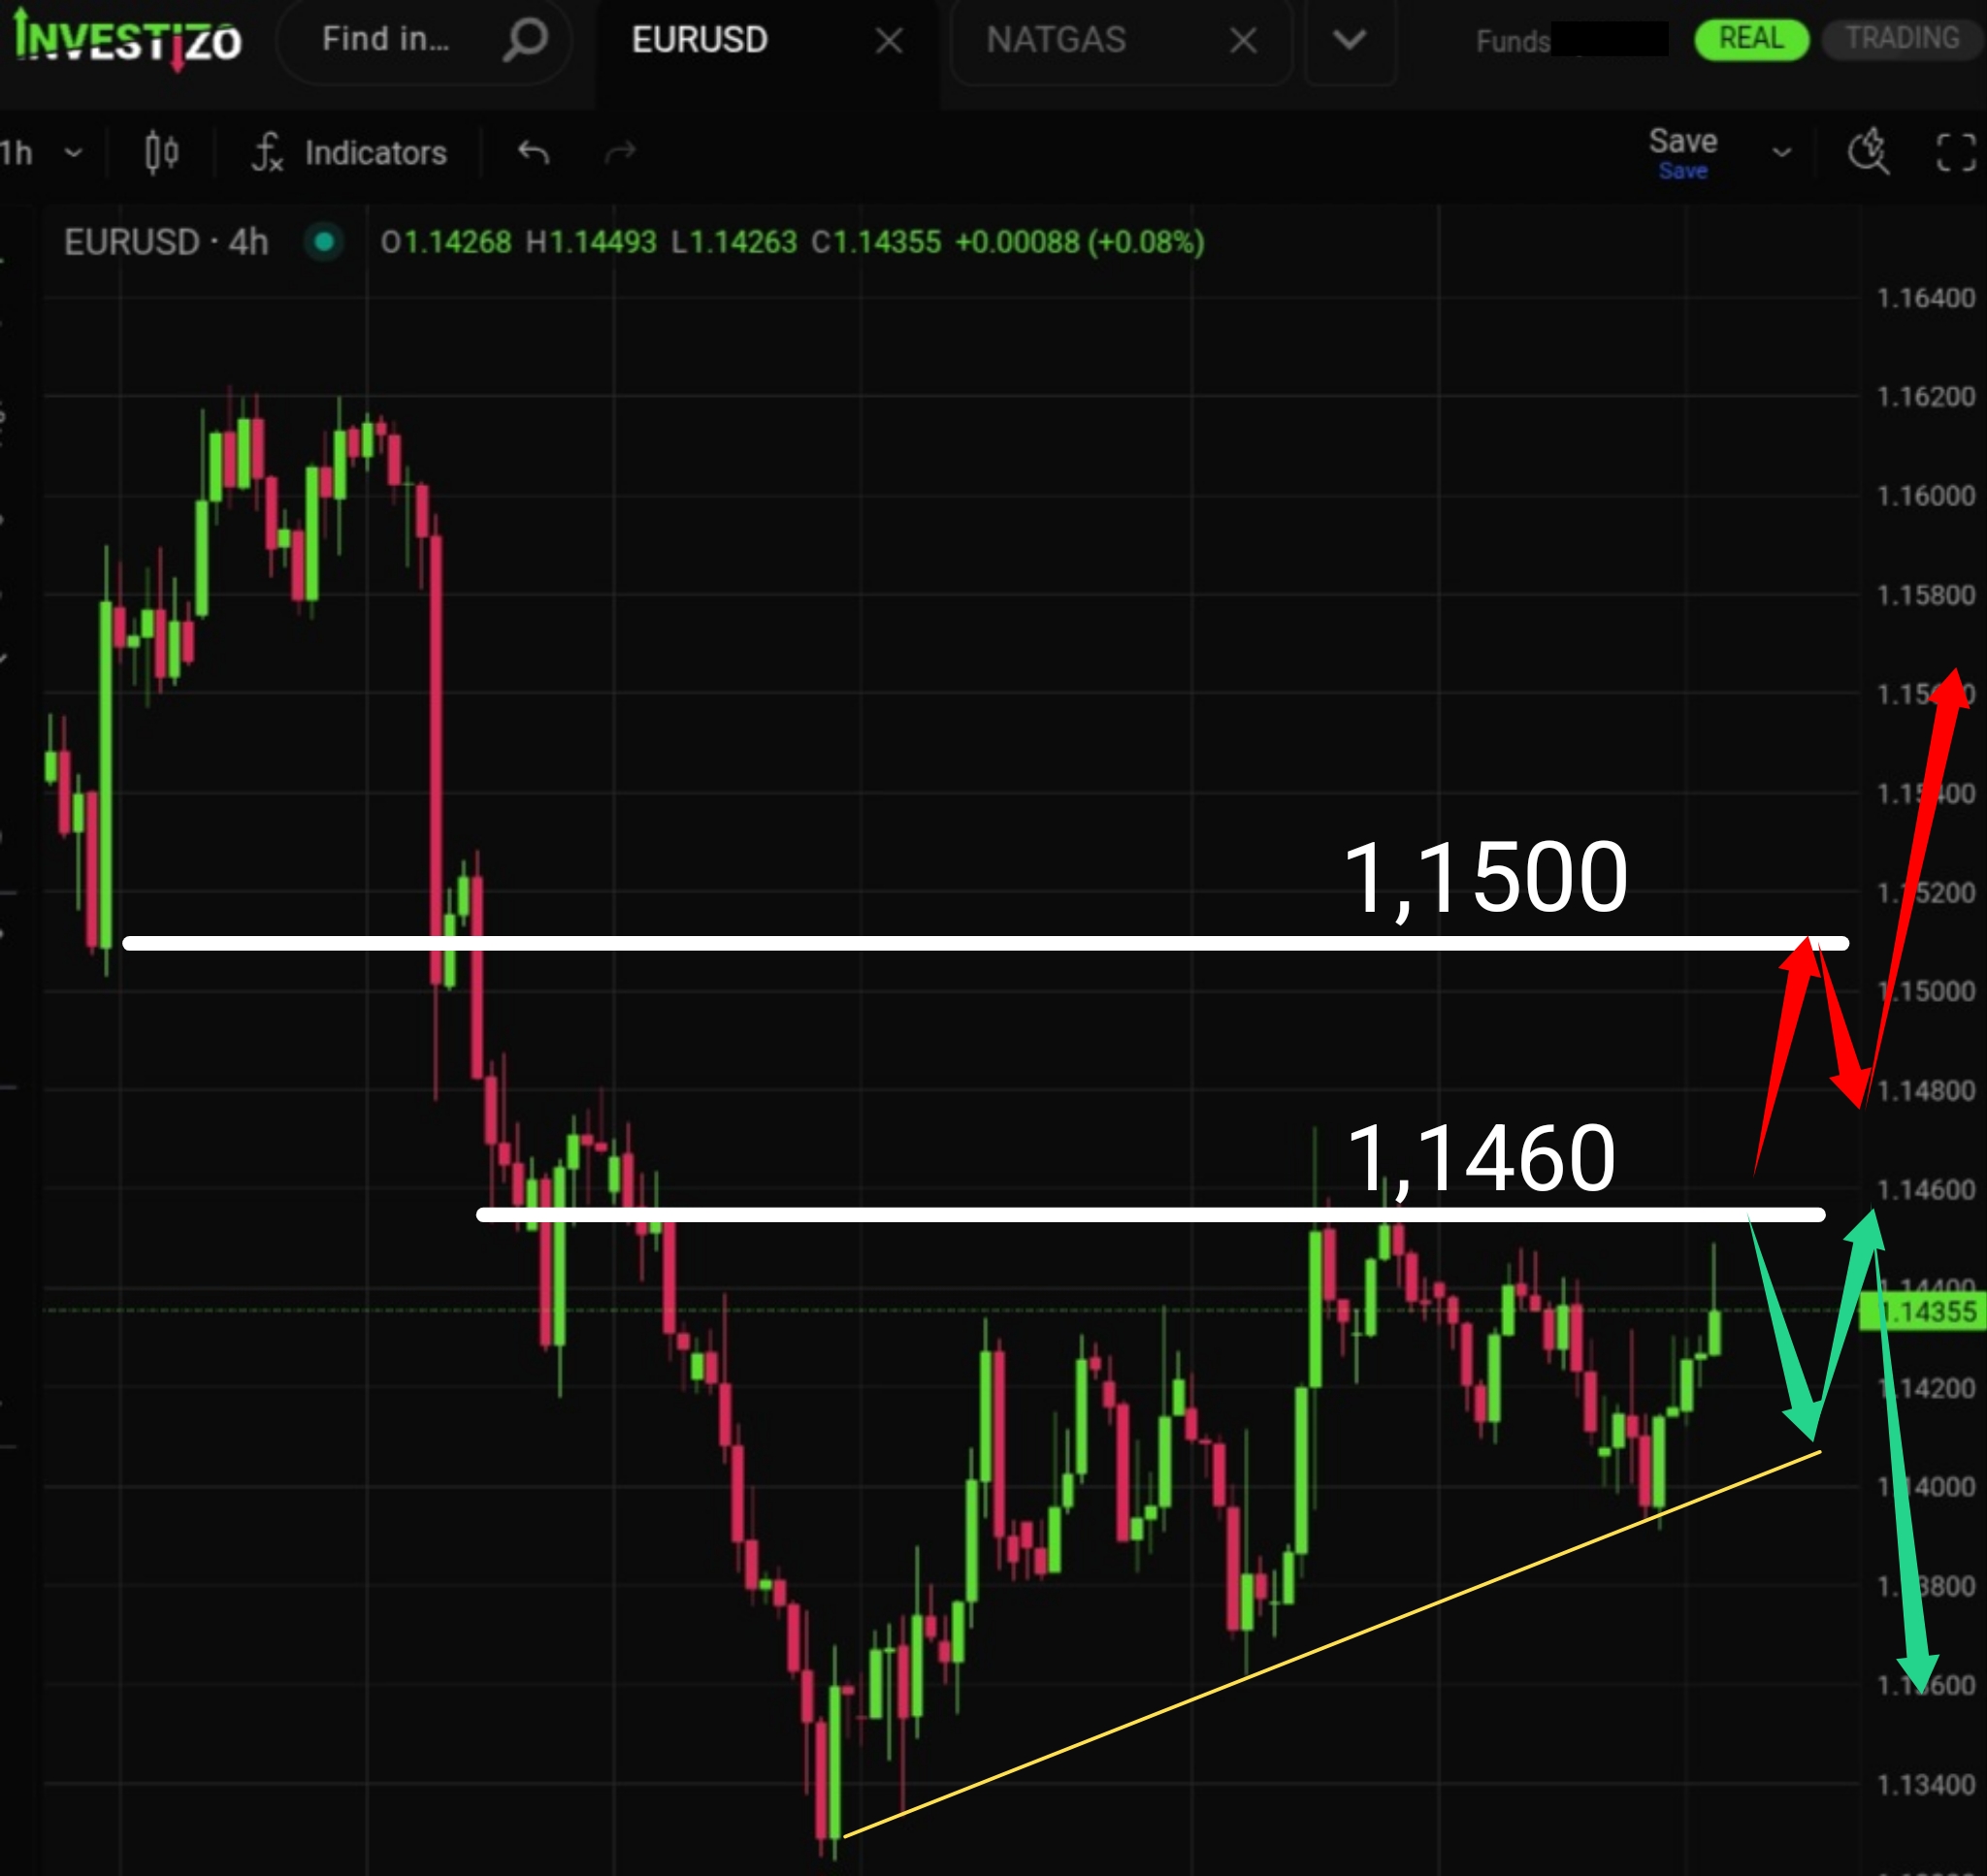
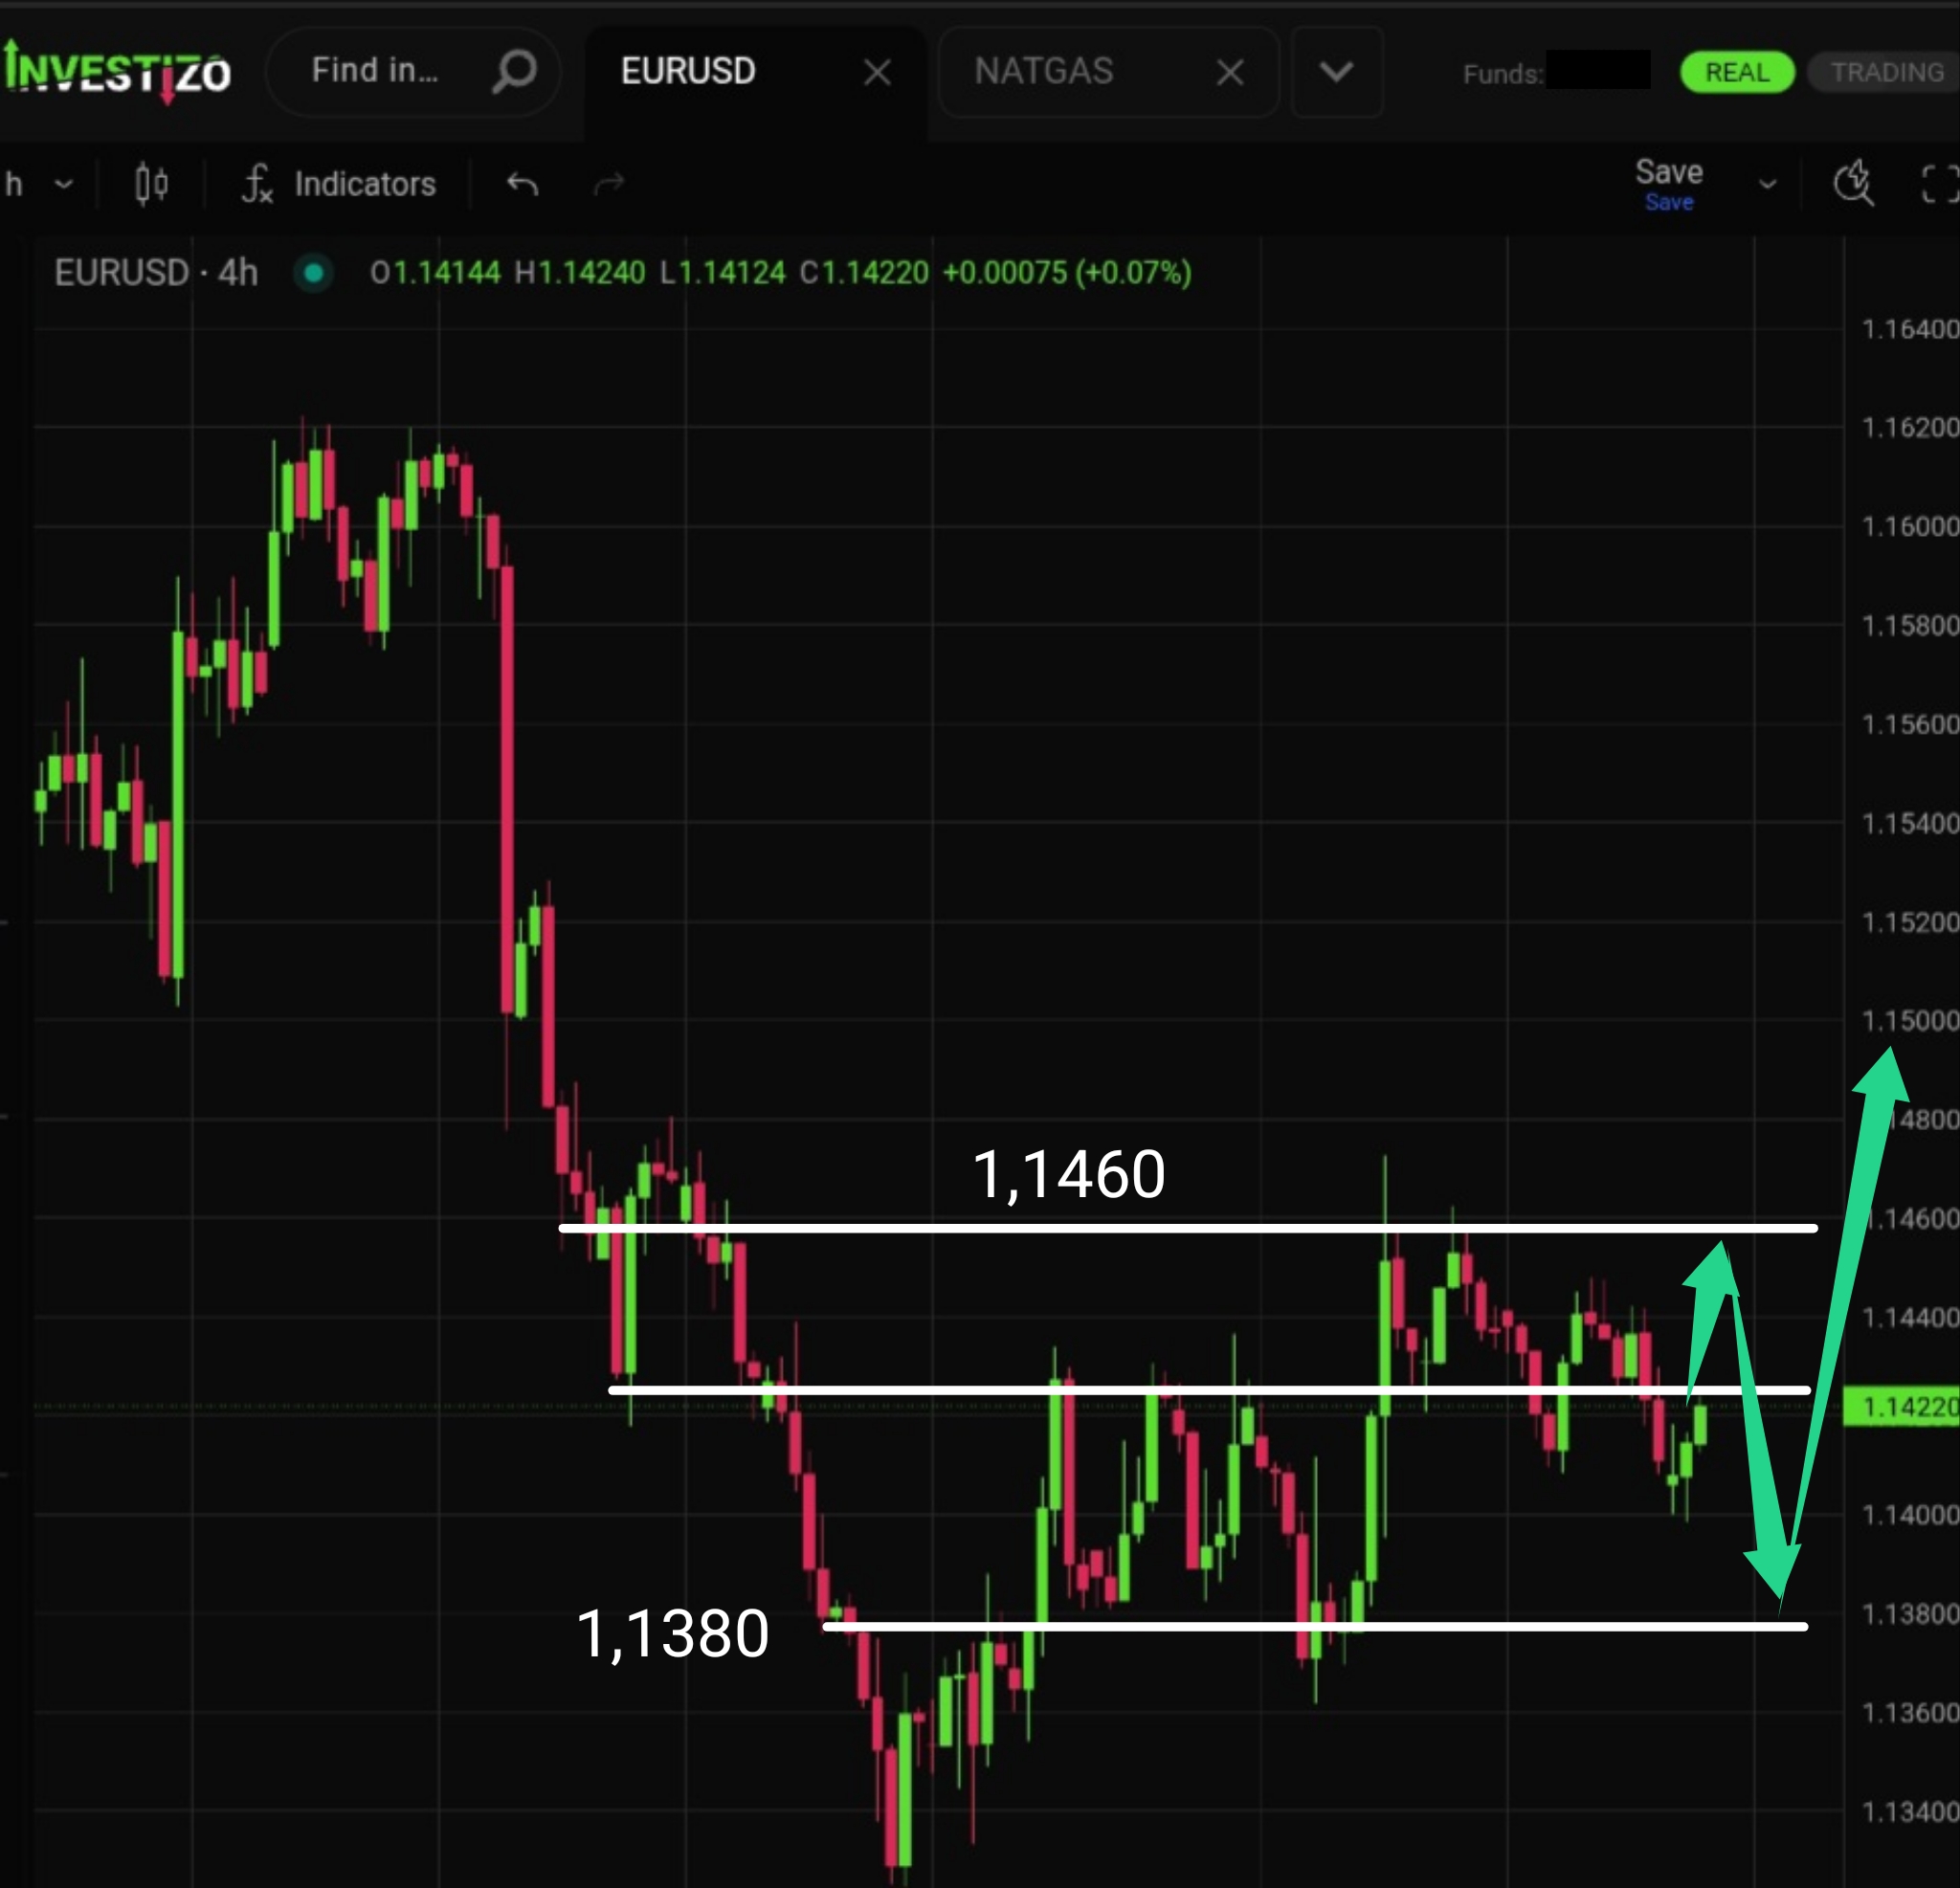
EUR/USD is approaching a critical breakout point within a narrowing triangle. With limited room left for consolidation, an impulsive move is expected soon. The key level to watch is 1.1460.
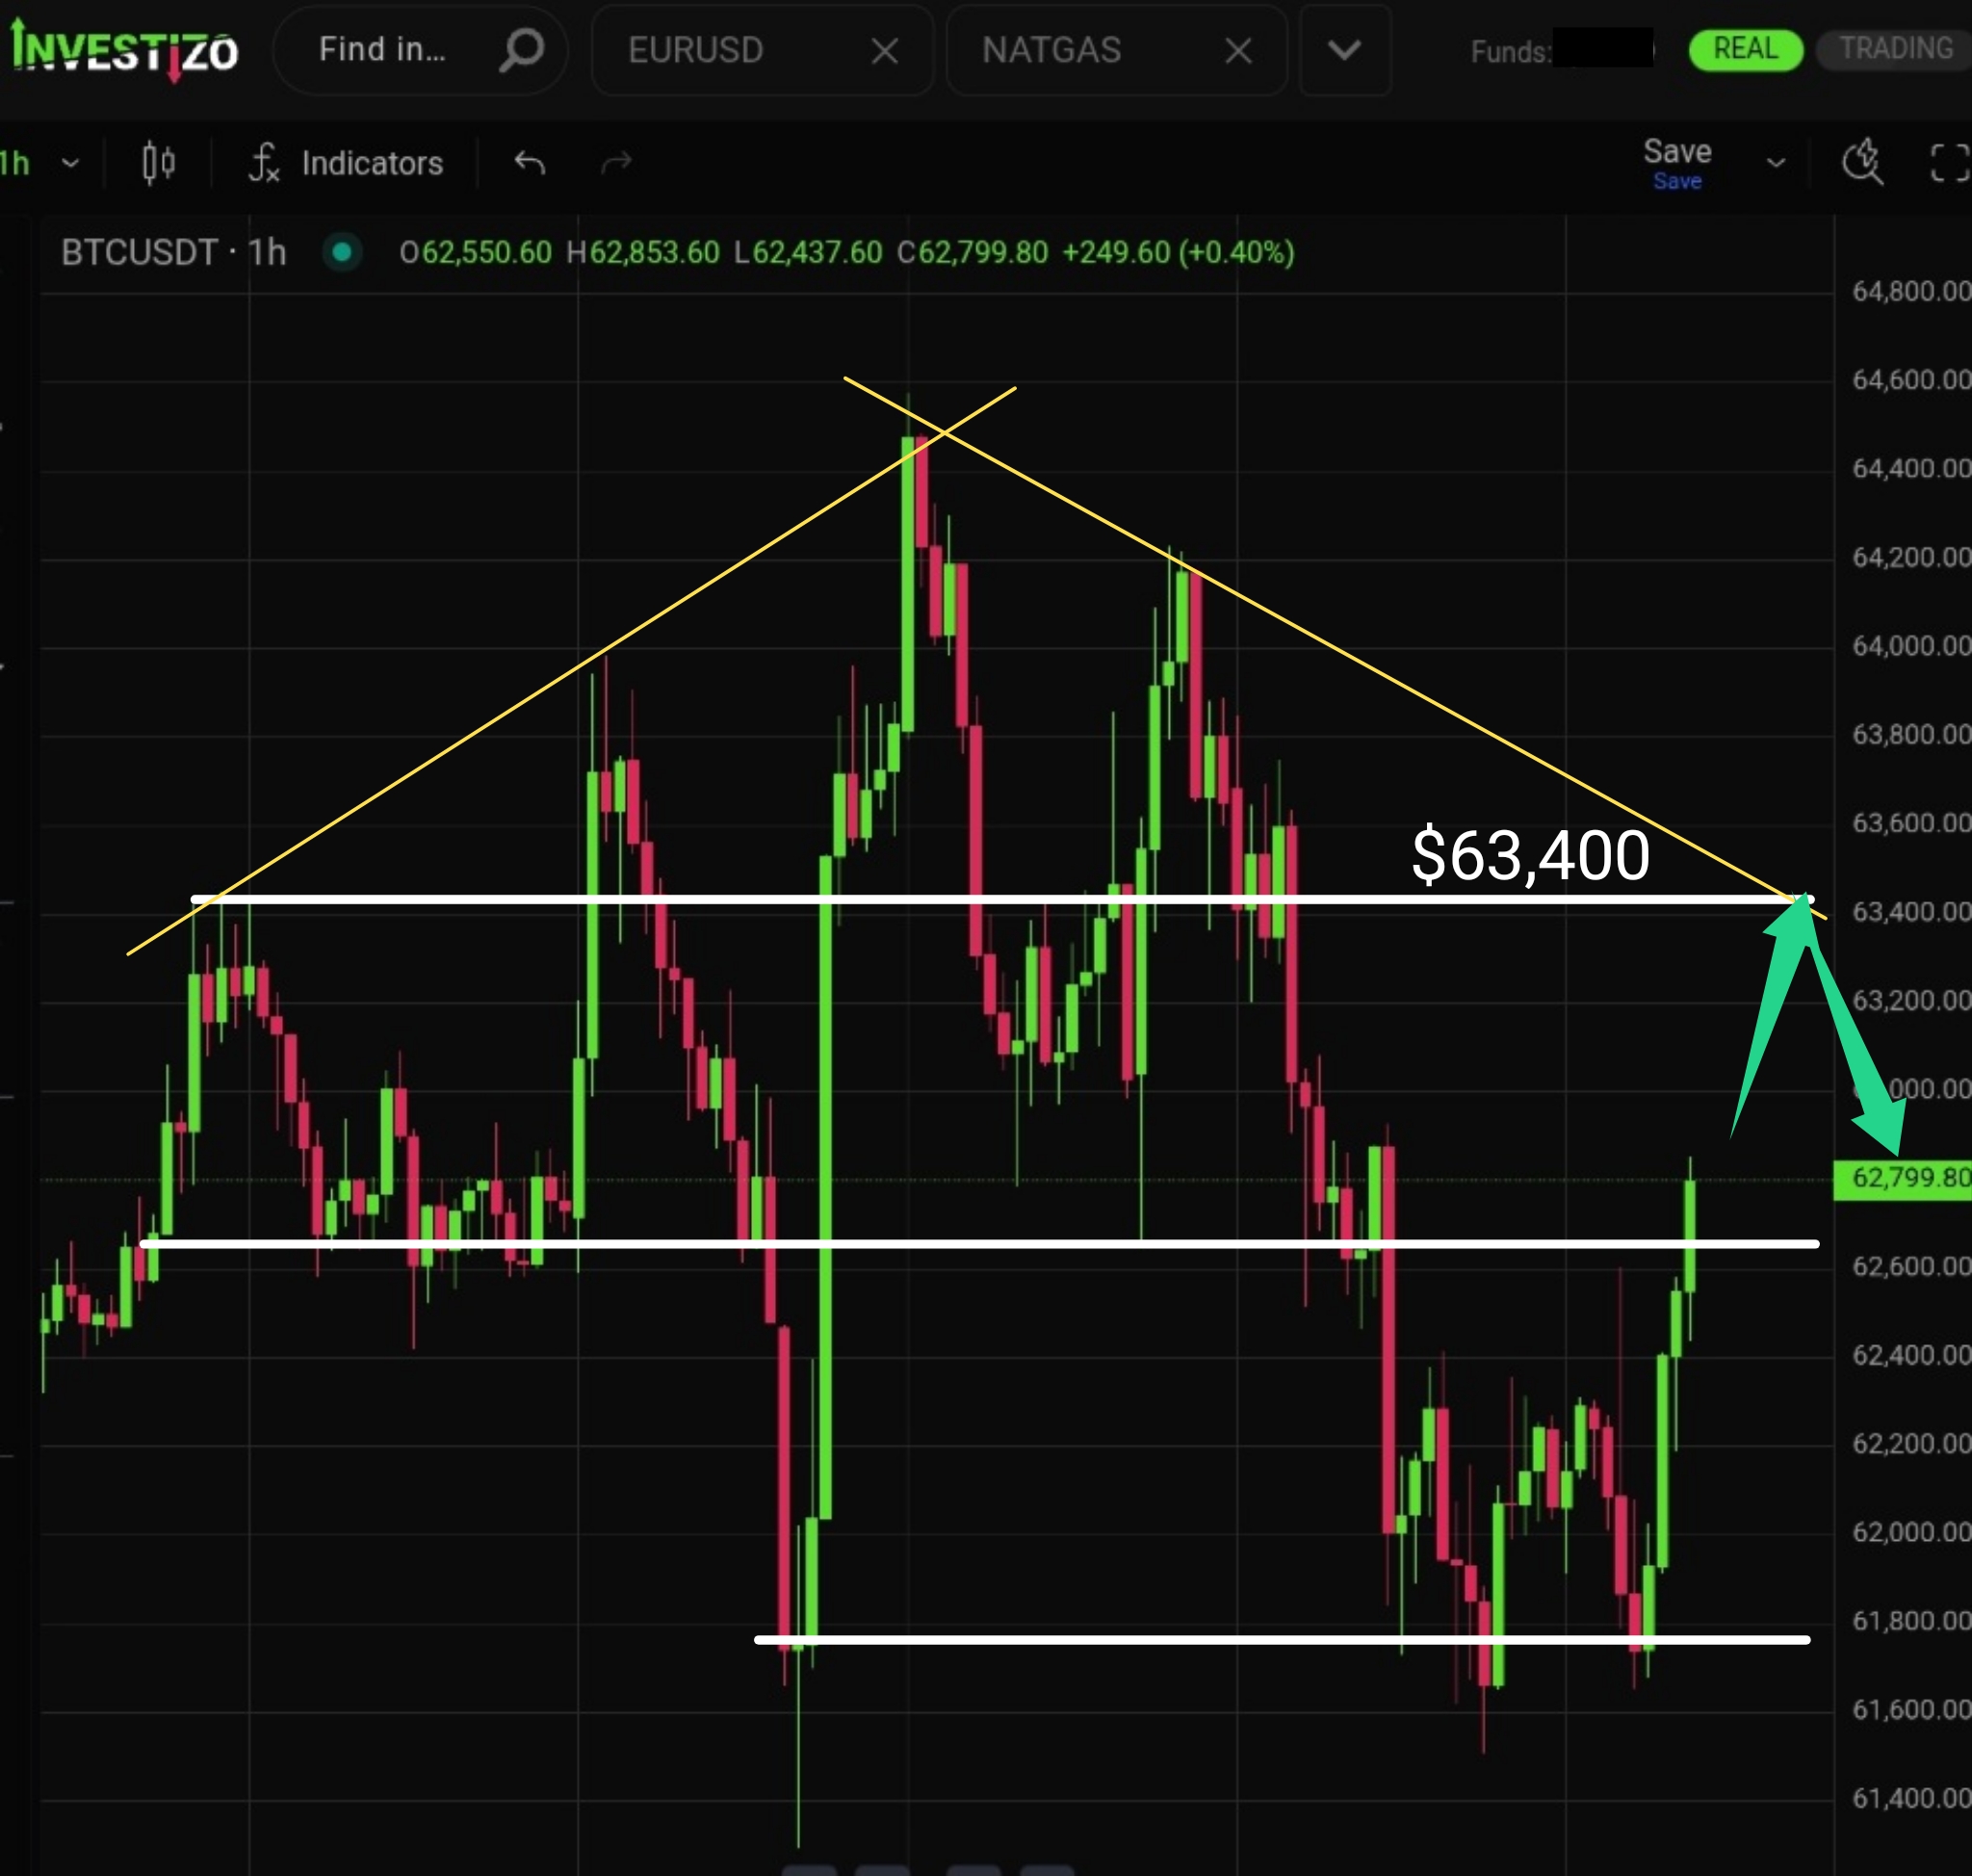
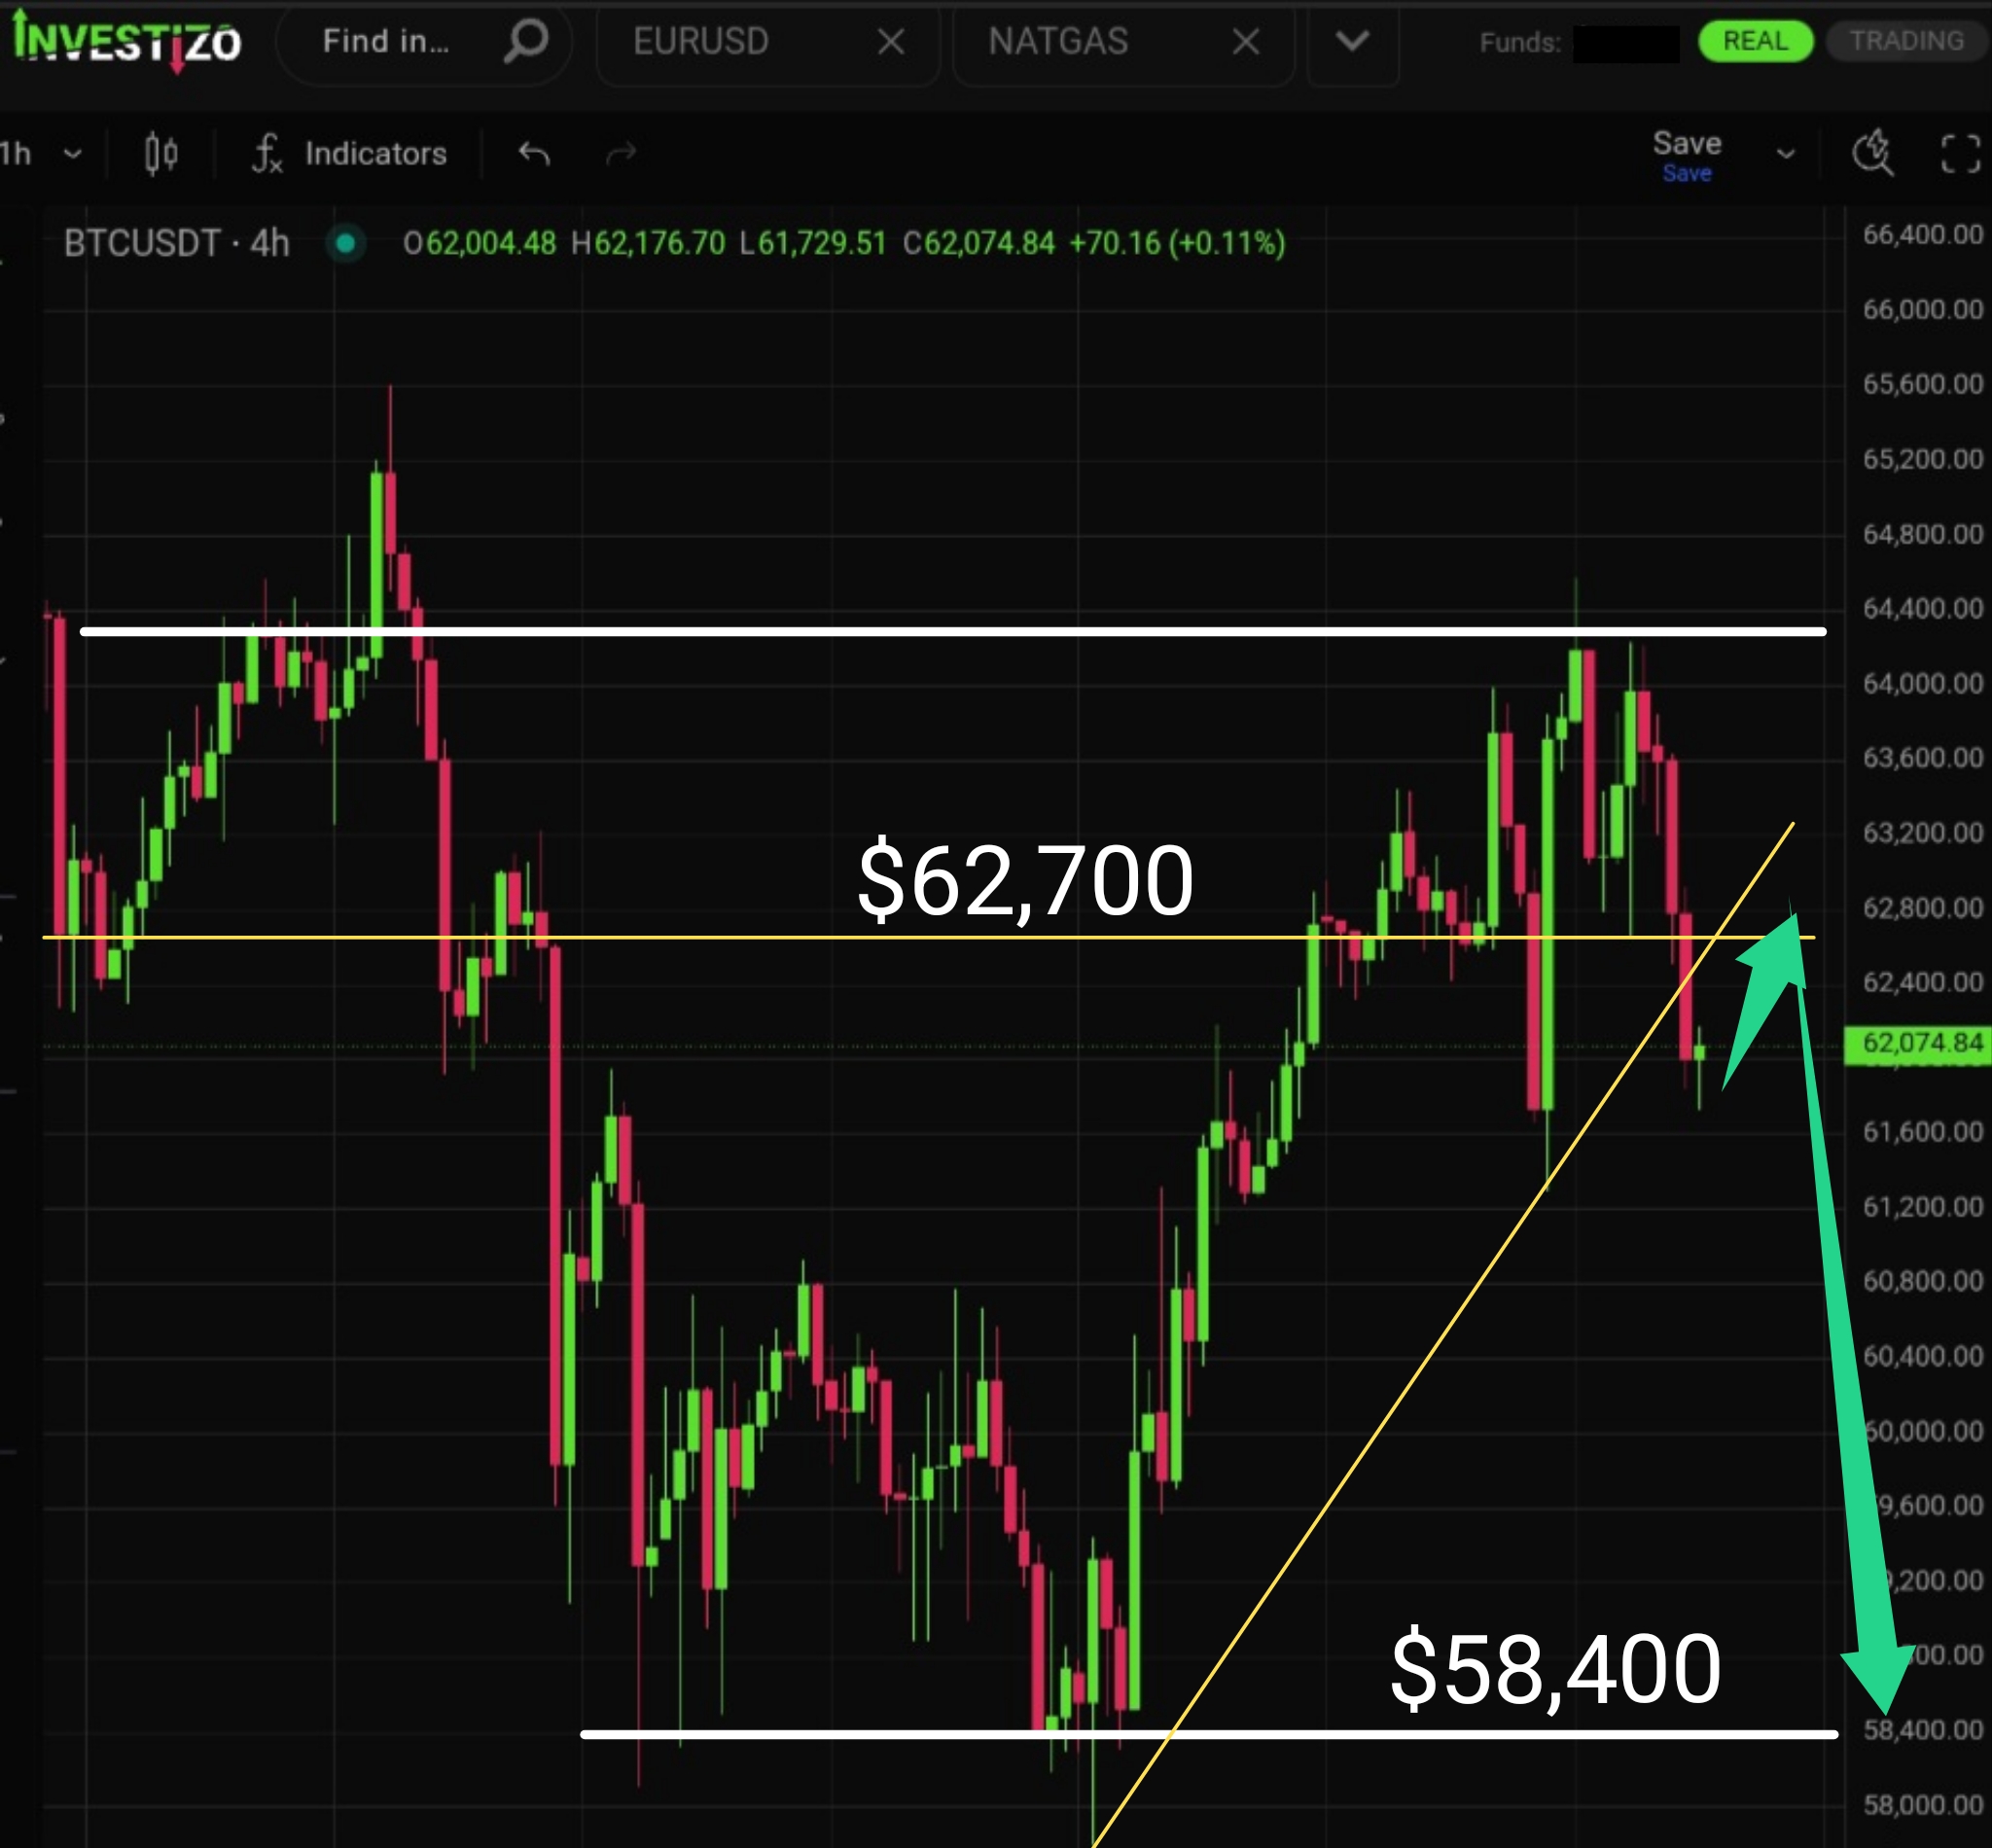
Bitcoin is currently range-bound on the H1 timeframe with no clear medium-term trend. Bulls are expected to struggle at a key resistance cluster near $63,400, likely leading to another leg lower.
Spot Gold (XAU/USD) trades at $4,103 this Thursday morning, undergoing steady consolidation roughly 25% below the historic record high of $5,600 established in January.
Brent Crude is trading at 77.75 this Thursday morning, consolidating slightly below an aggressive intraday thrust to 80.00. The energy complex has absorbed the latest Middle Eastern military escalation with relative restraint.
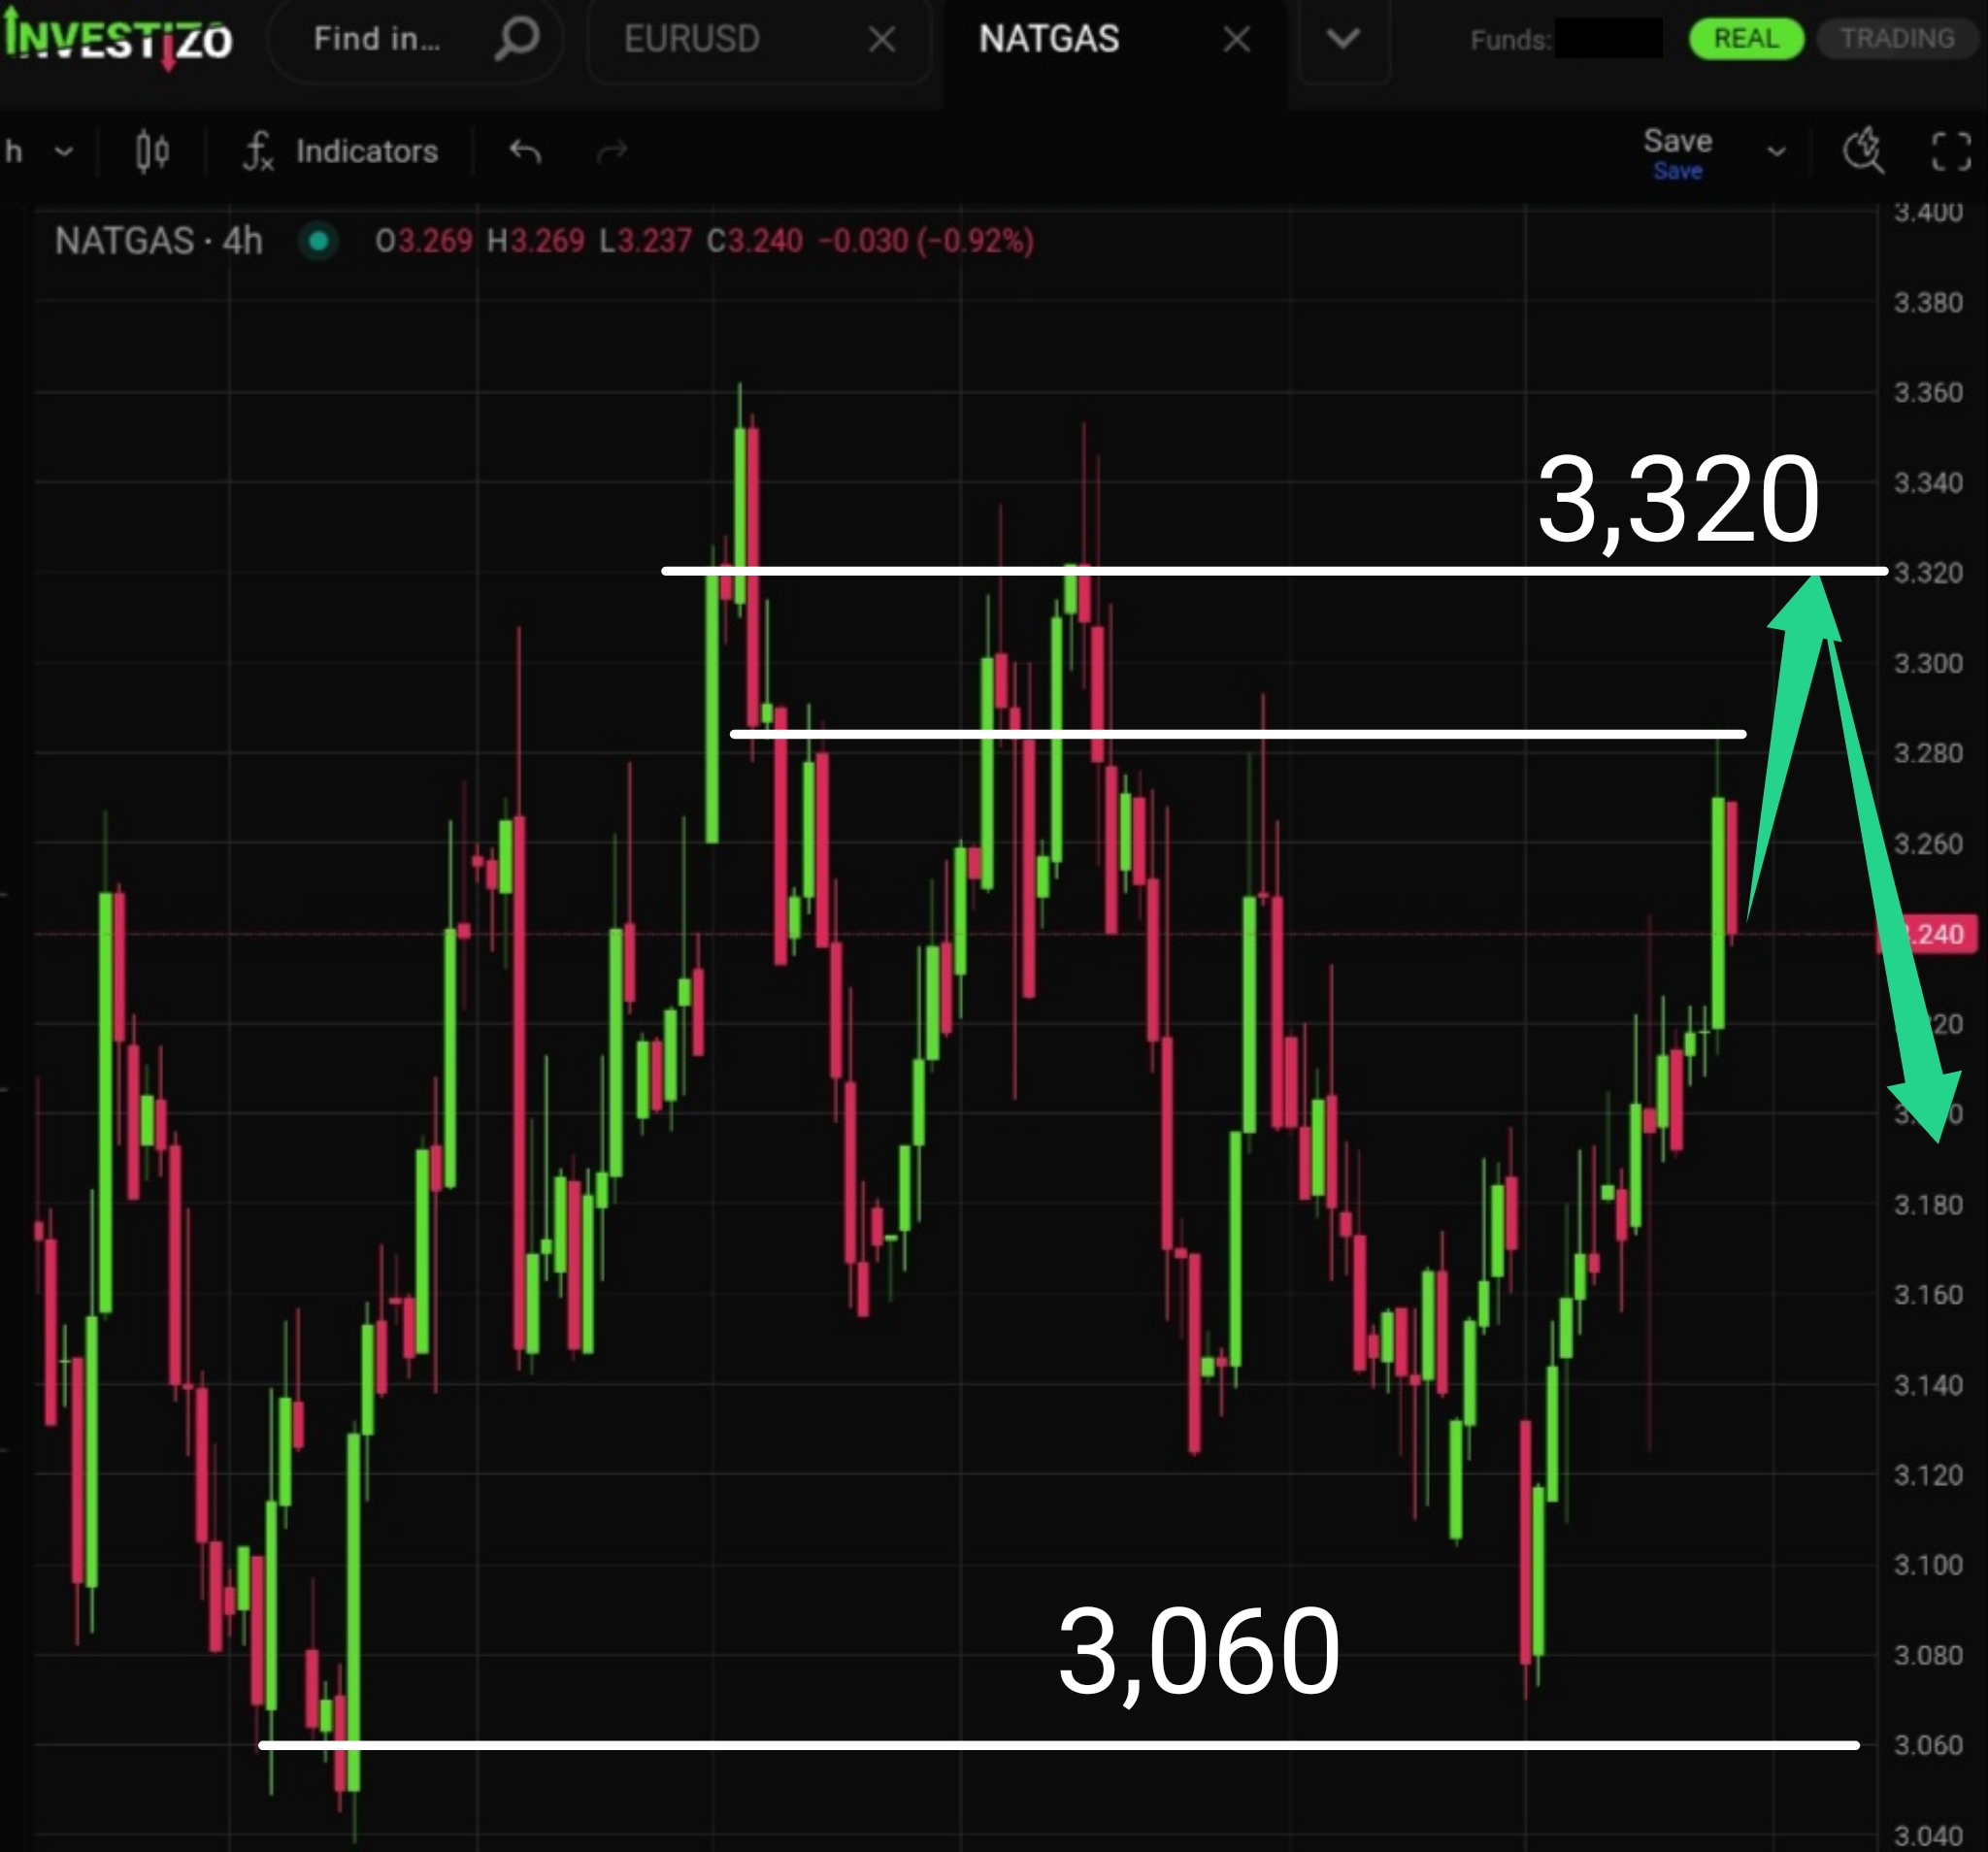
Natural Gas is in the final stage of its upward impulse and is likely to face strong resistance in the 3,320 supply zone. A confirmed reversal from this level could open the way for a decline toward the key support at 3,060.
Bitcoin remains fragile and continues to dismantle the myth of being a “safe-haven asset” and reliable “store of value.”
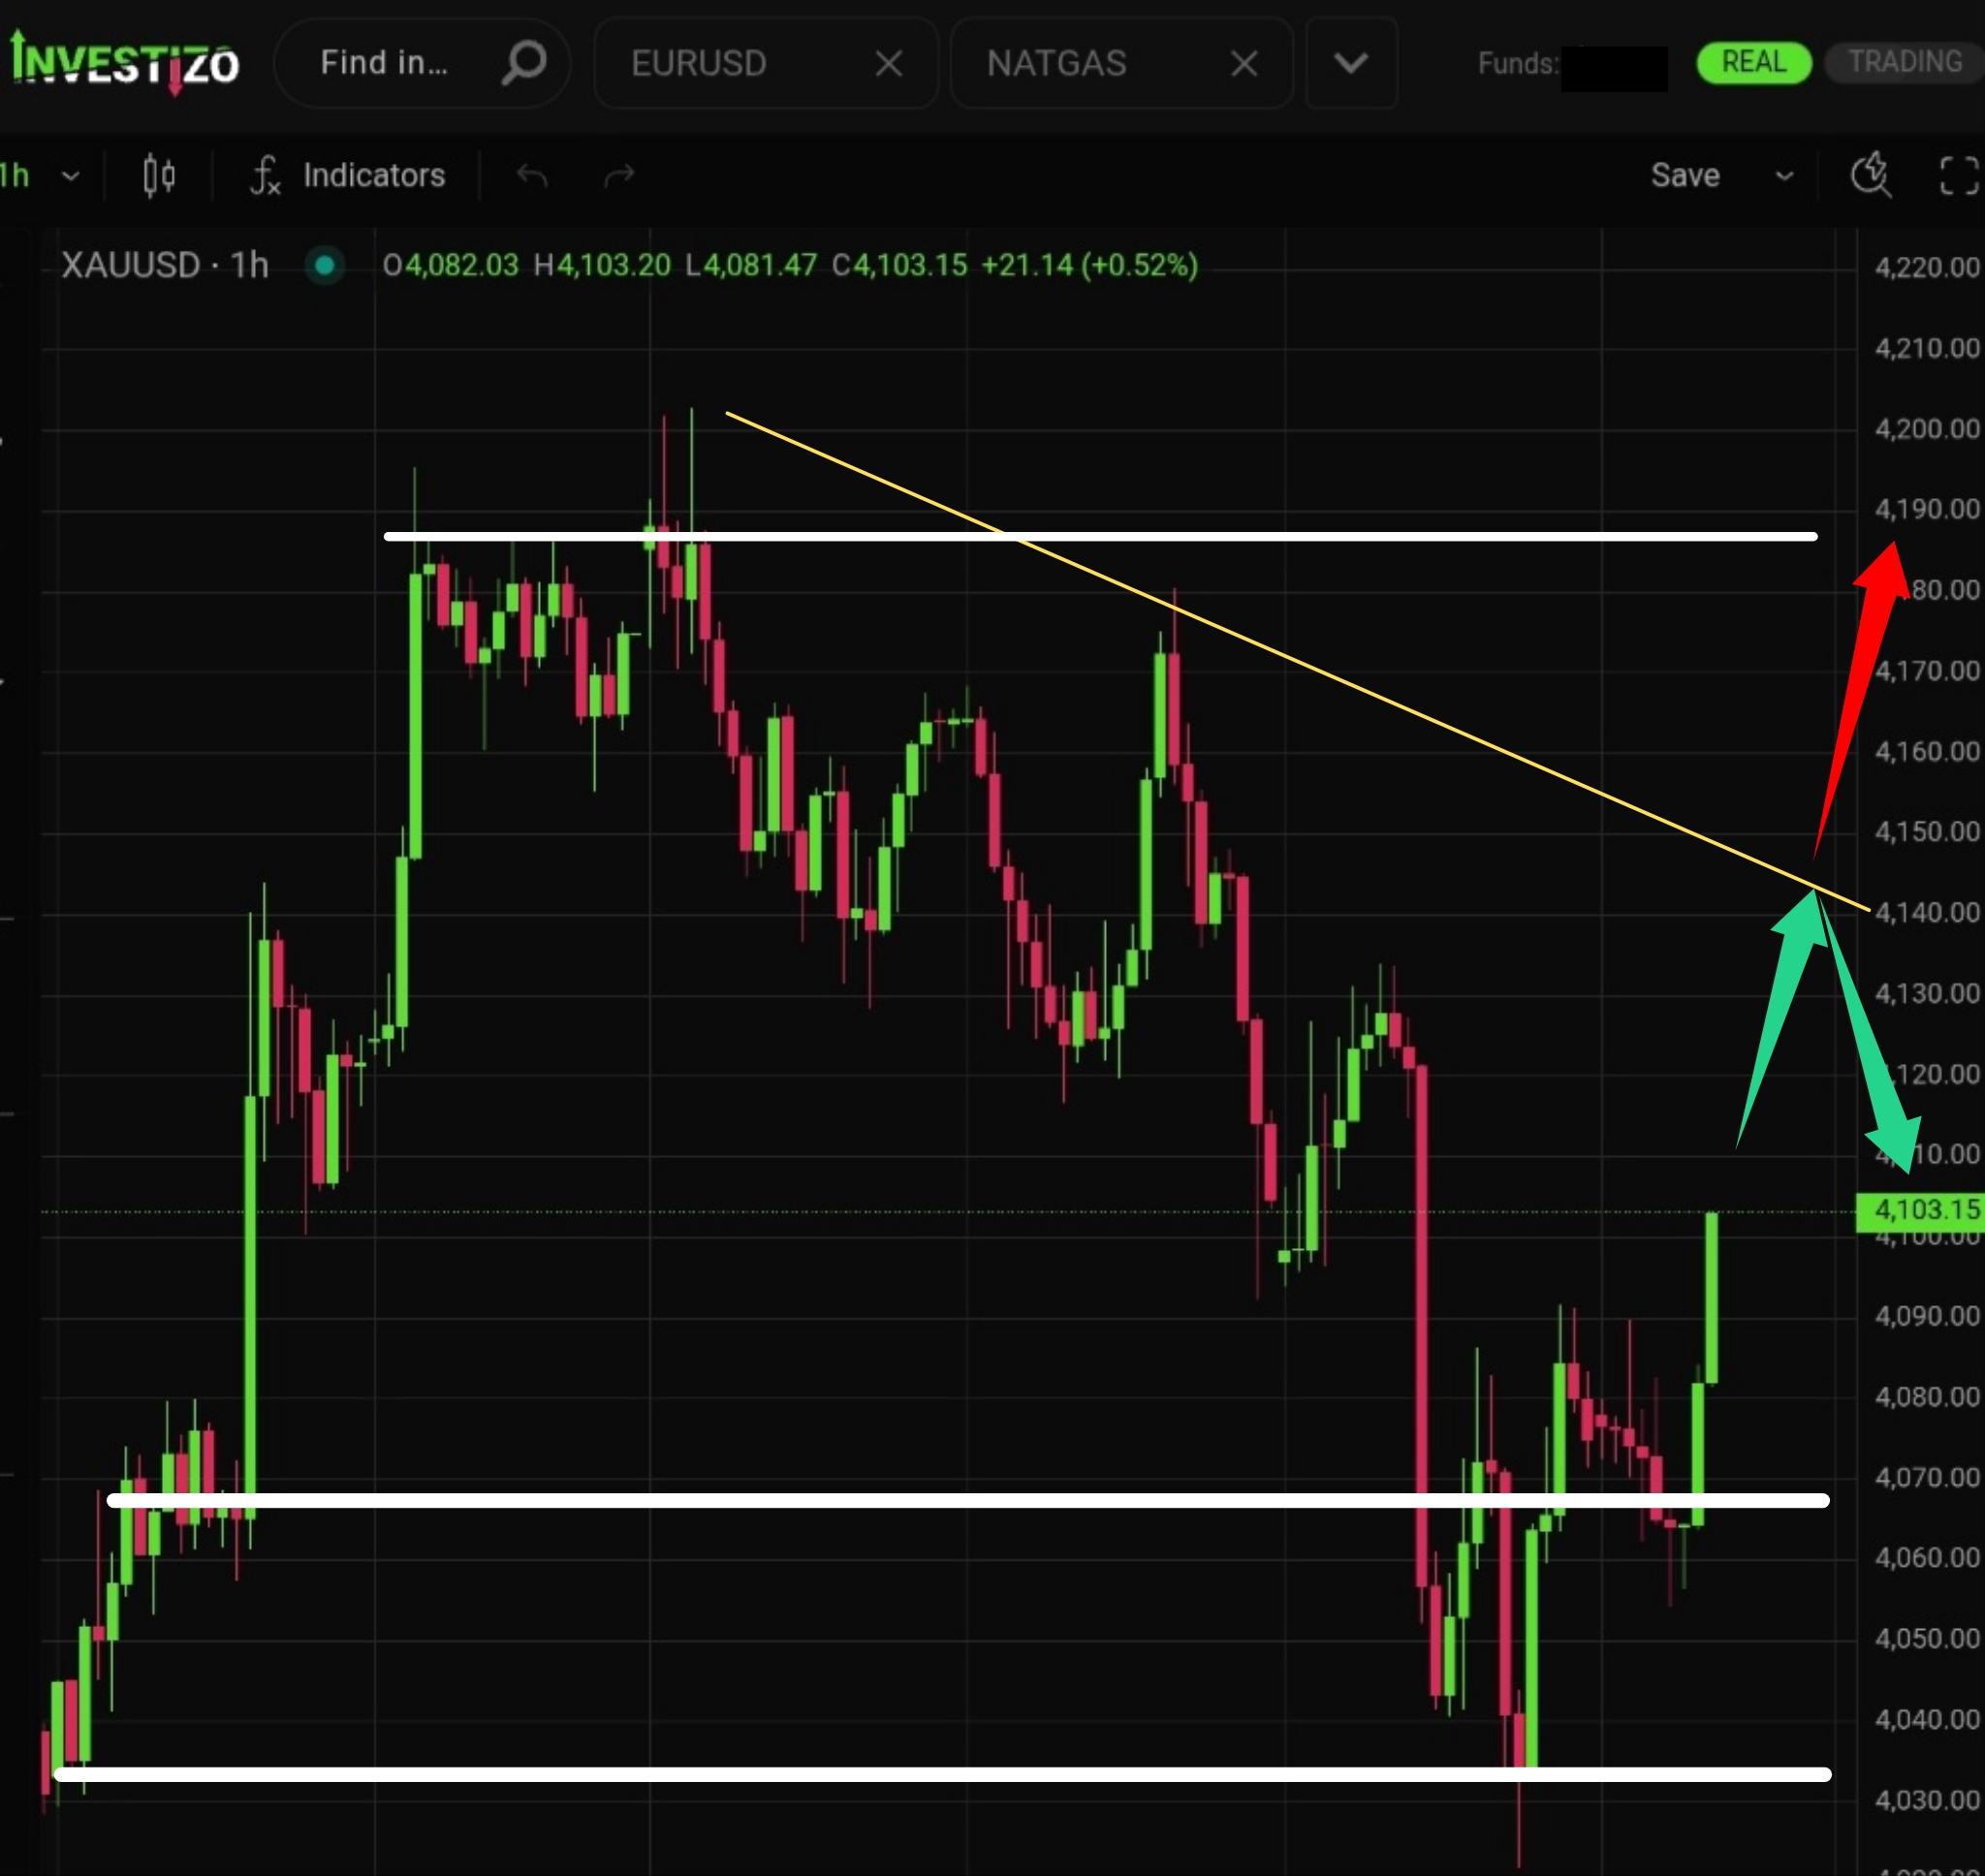
Gold (XAU/USD) is in an intense decline on the H1 timeframe. Key supports lie at $4,030 and $3,960, where buying interest may trigger rebounds.
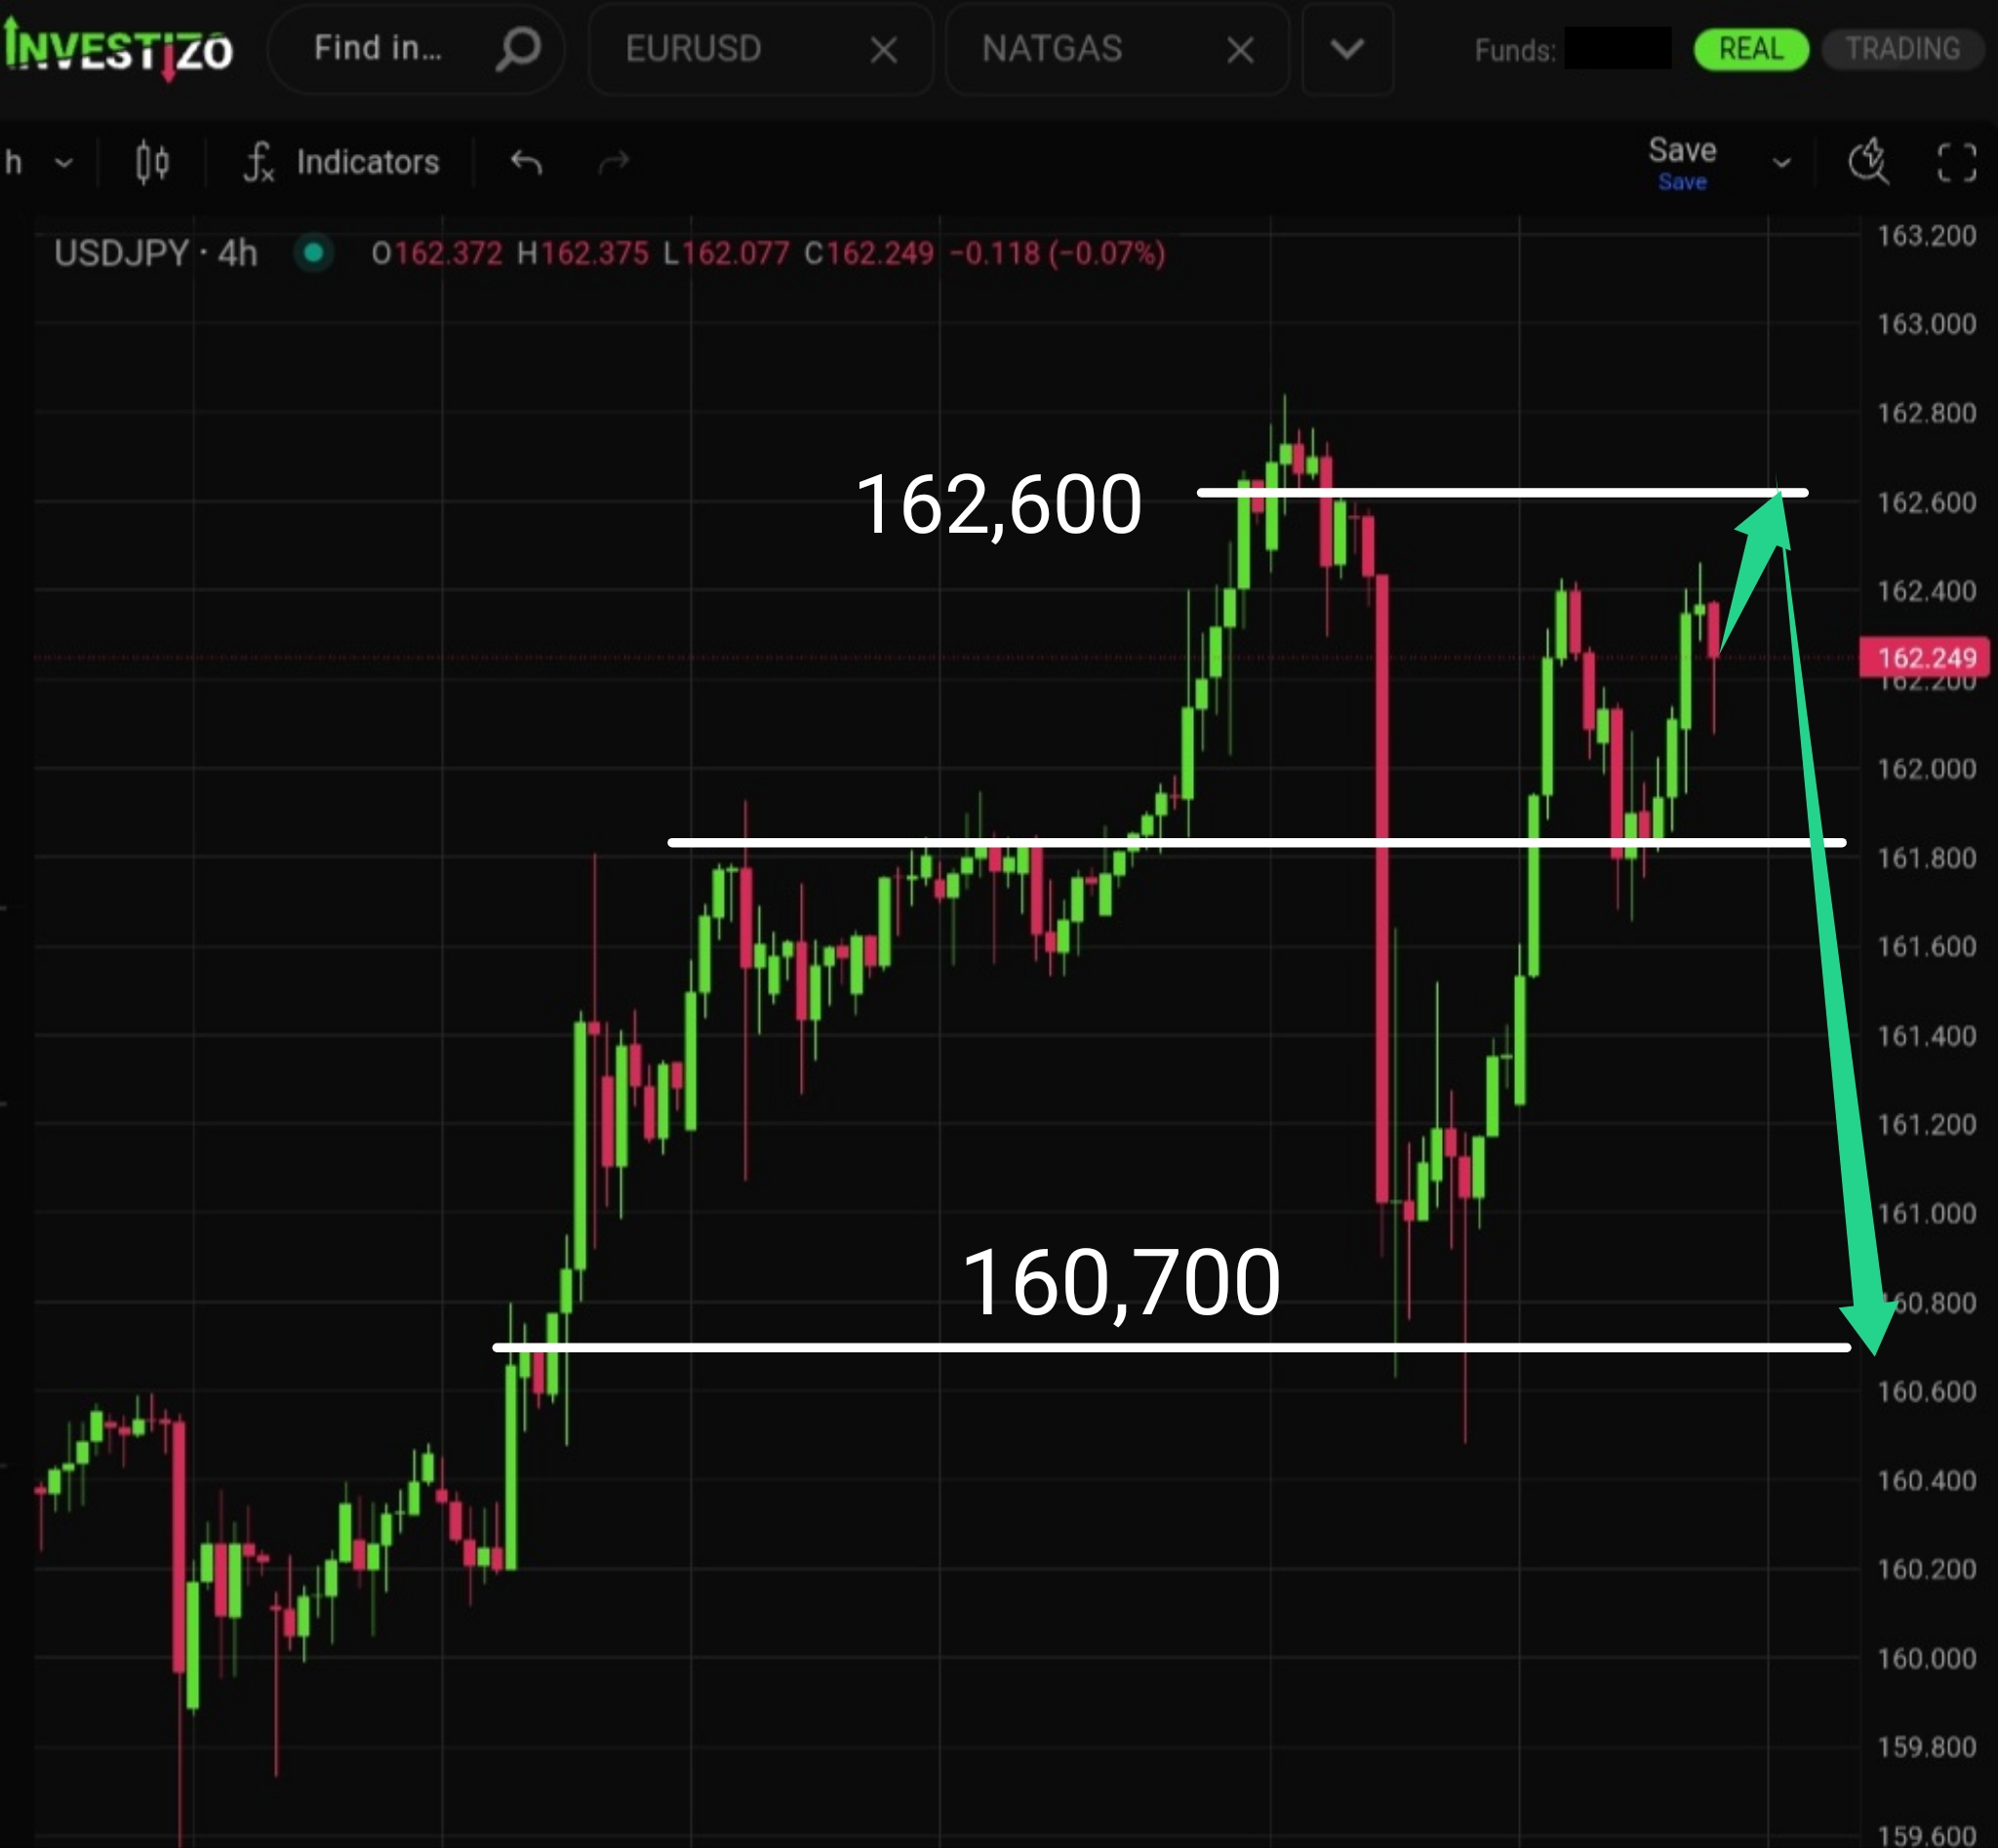
USD/JPY remains poised for a bearish reversal from the 162,600 supply zone. A test of this level followed by rejection could trigger a ~200-pip decline toward 160,700 support.
EUR/USD remains in a consolidation phase. Bulls possess a solid base for an upward impulse, but the market is not yet ready to activate this potential. Continued range trading is expected before a likely breakout higher.