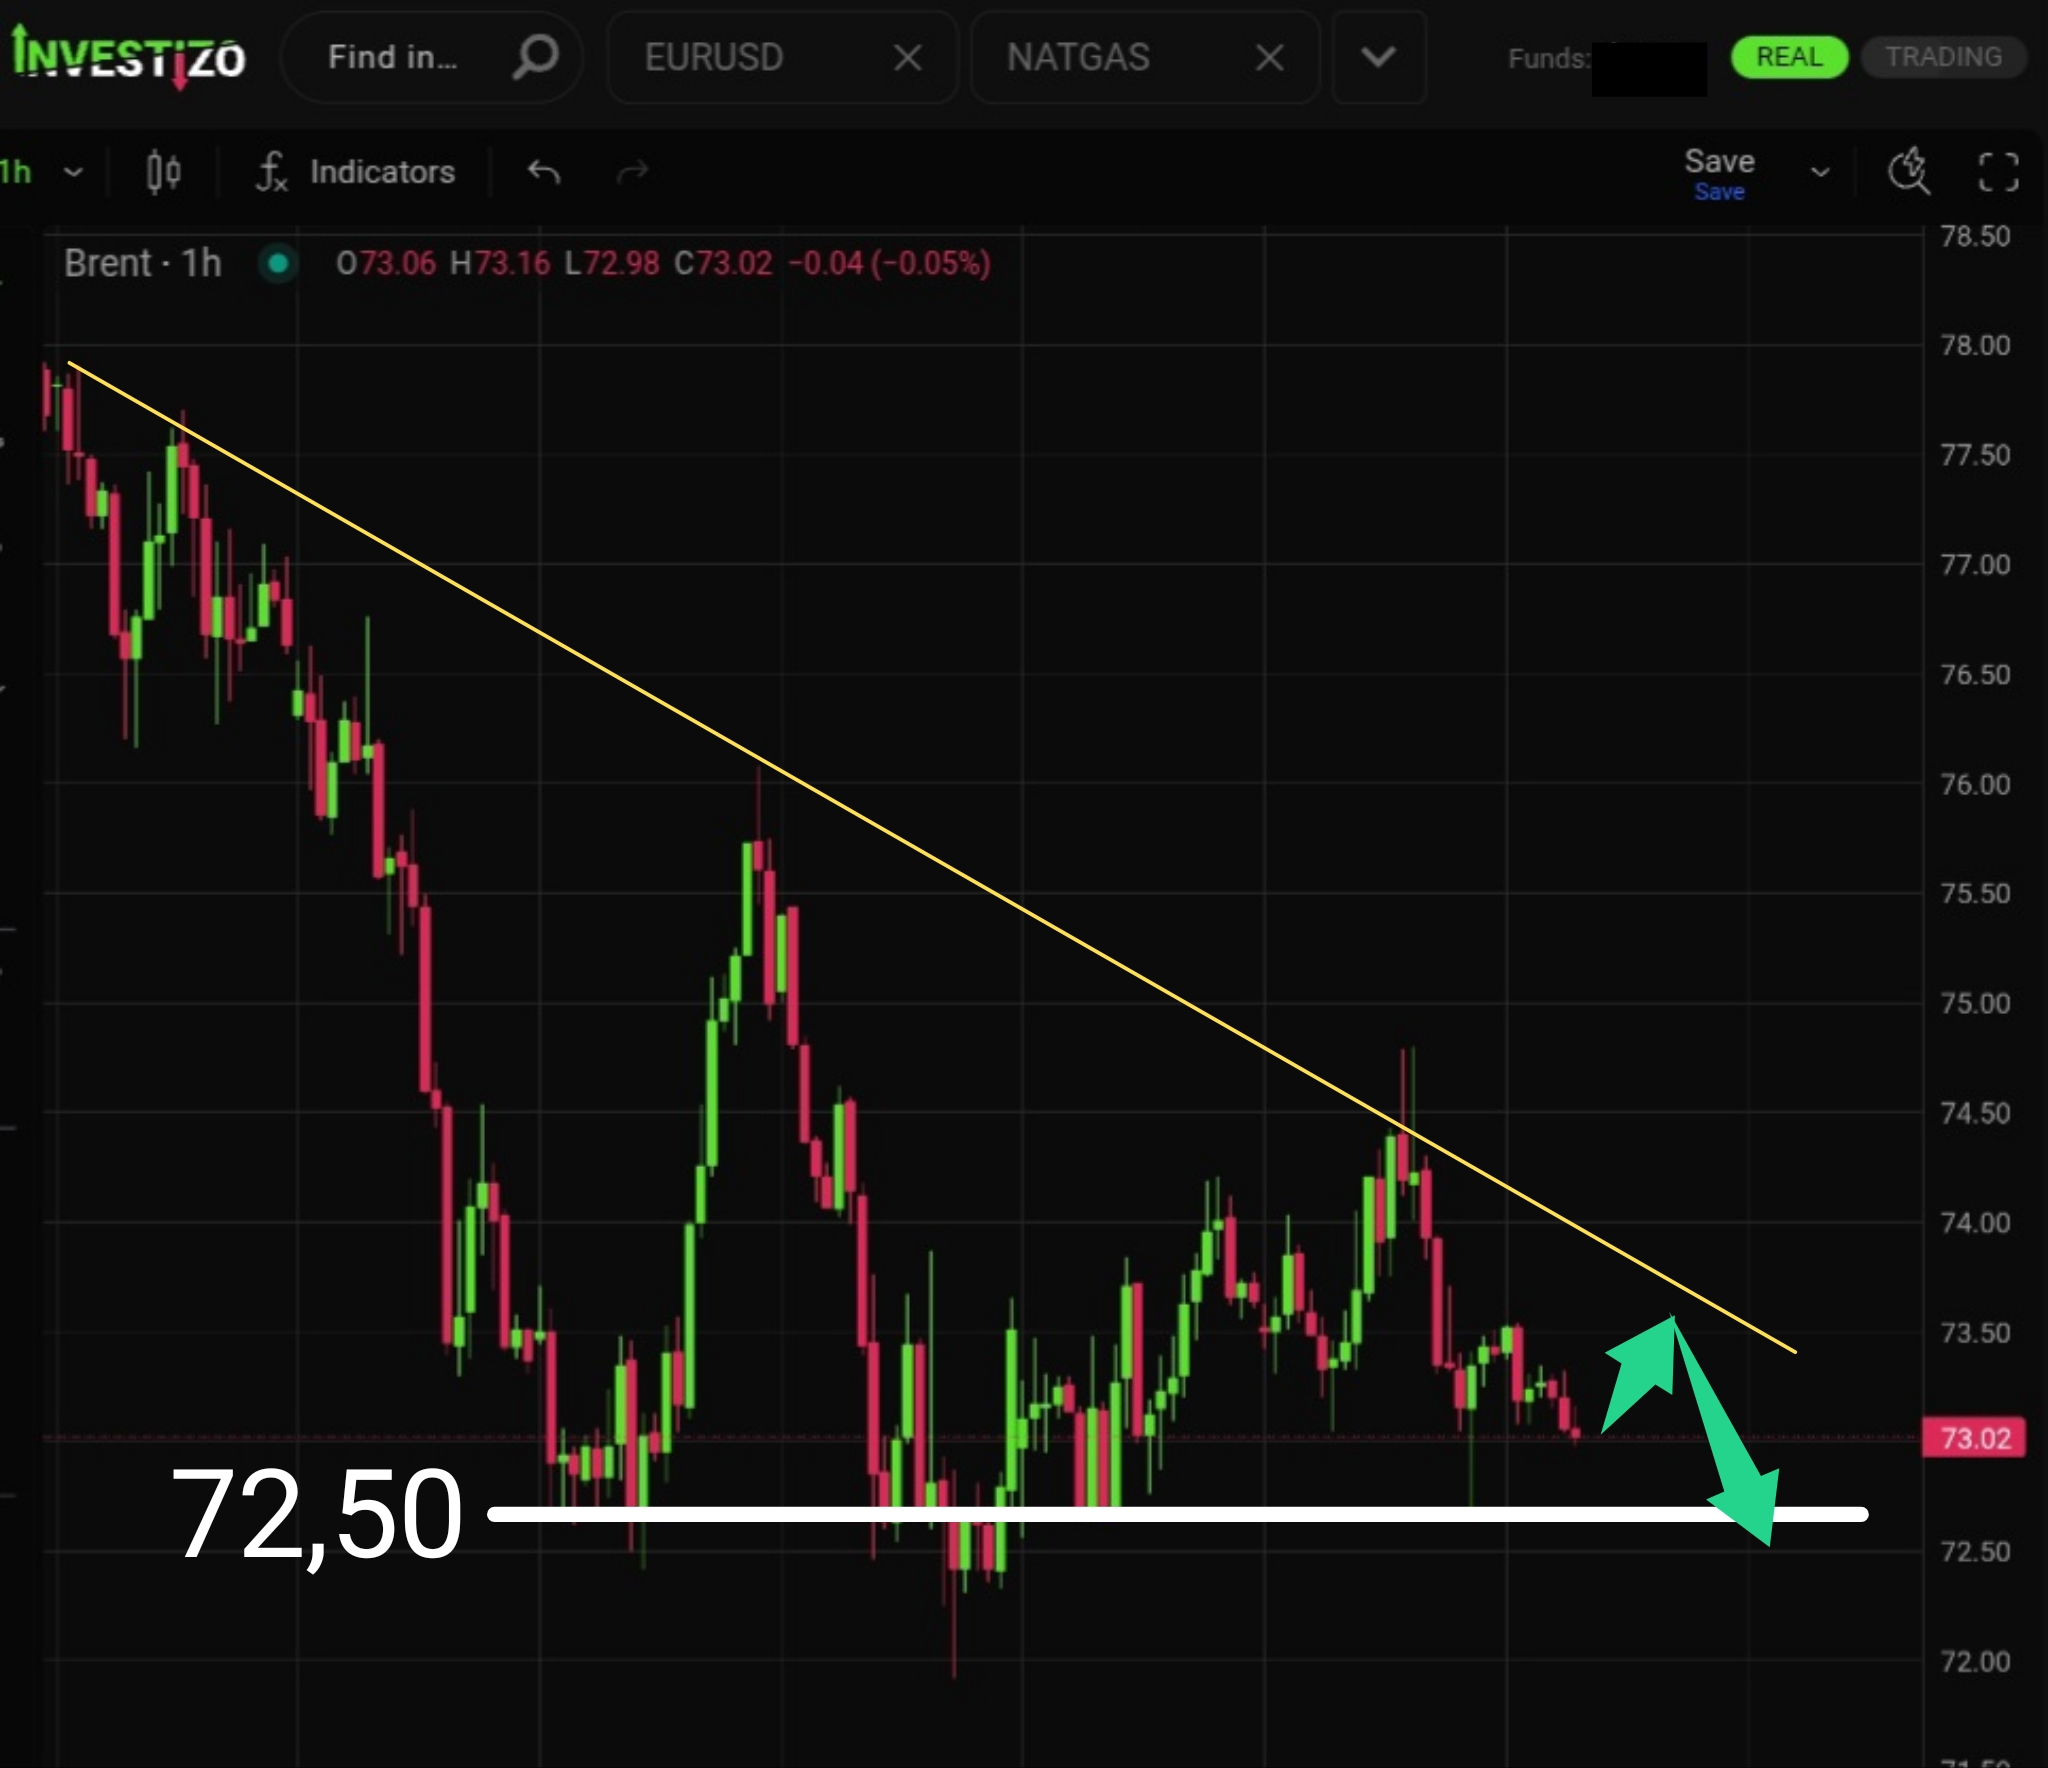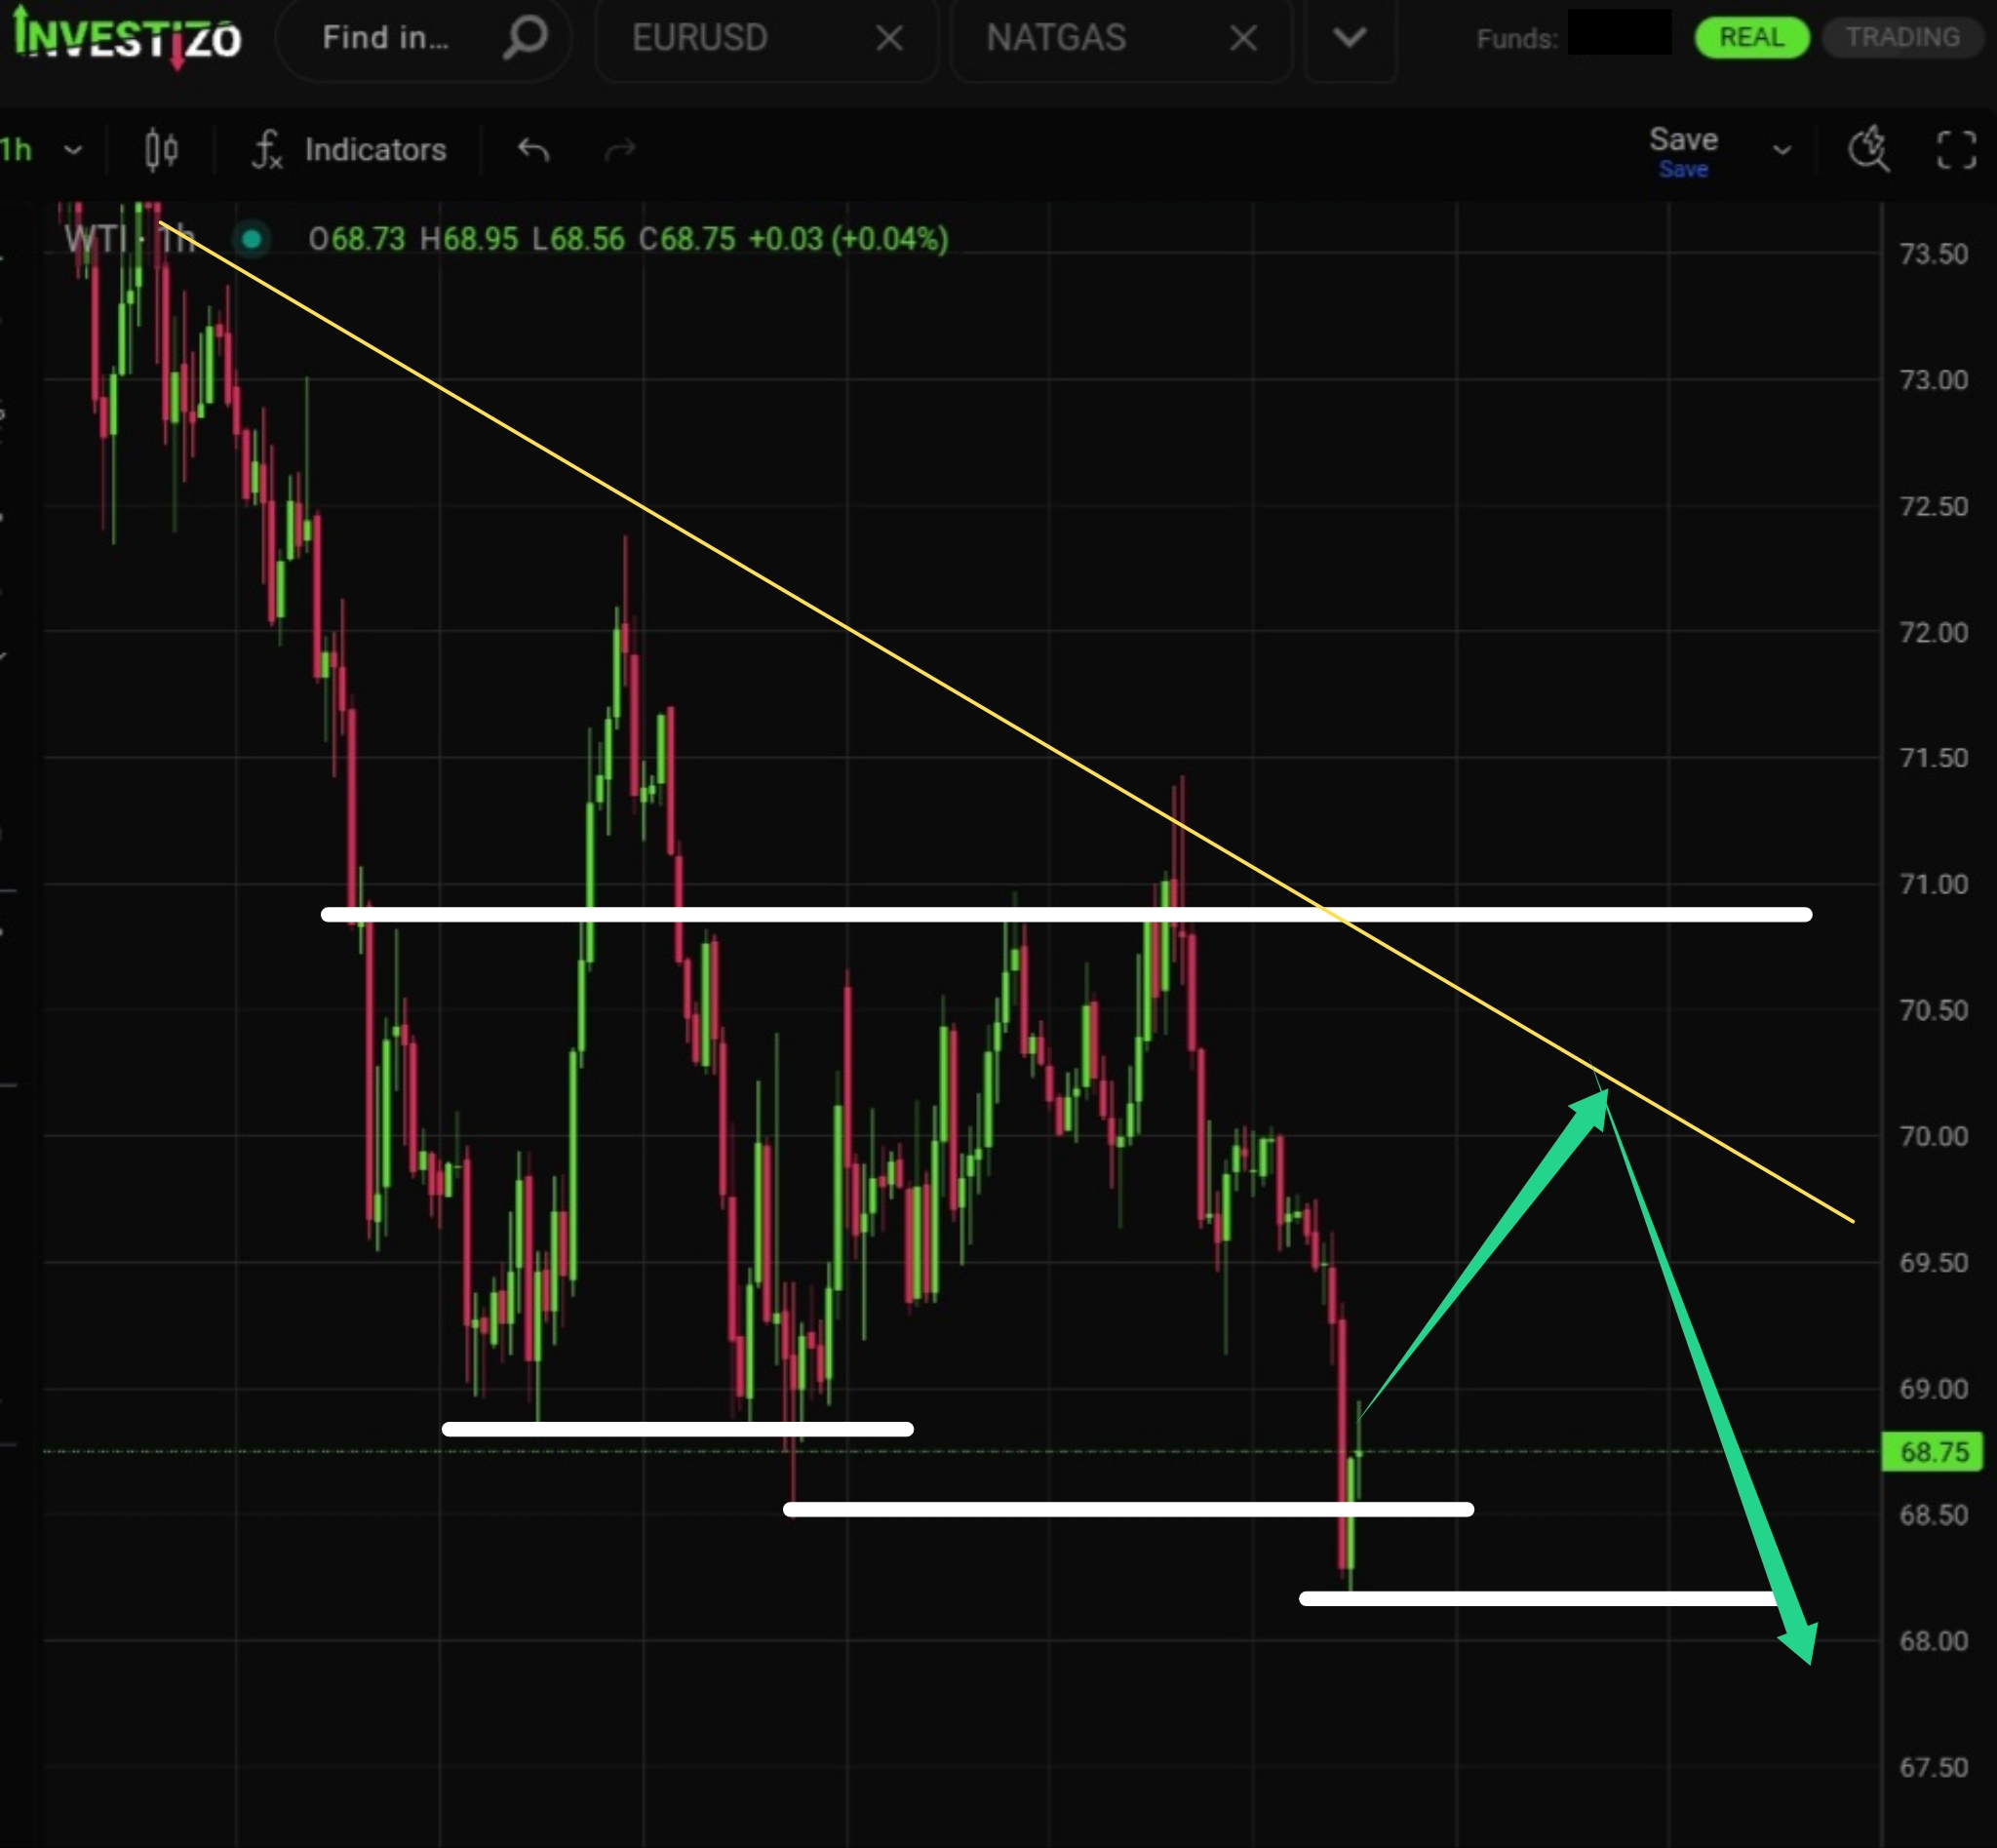
WTI Crude Oil, Technical Analysis – H1
The downtrend remains intact. However, the recent formation of a new low opens the door for an upward technical correction.
Investizo LTD. Business company number 25432 BC 2019
Suite 305, Griffith Corporate Centre,
P.O. Box 1510, Beachmont, Kingstown,
St. Vincent and the Grenadines
DUNS 817053497
Phone:+996312610515
E-mail: [email protected]
© 2019-2026 Investizo 18+ Hak cipta terpelihara
Amaran Risiko: CFD adalah produk kewangan kompleks yang diperdagangkan berdasarkan margin. Perdagangan CFD berisiko dan mungkin tidak sesuai untuk sebilangan pelabur. Pastikan anda memahami risiko yang dihadapi kerana anda mungkin kehilangan semua modal yang anda laburkan.
The downtrend remains intact. However, the recent formation of a new low opens the door for an upward technical correction.
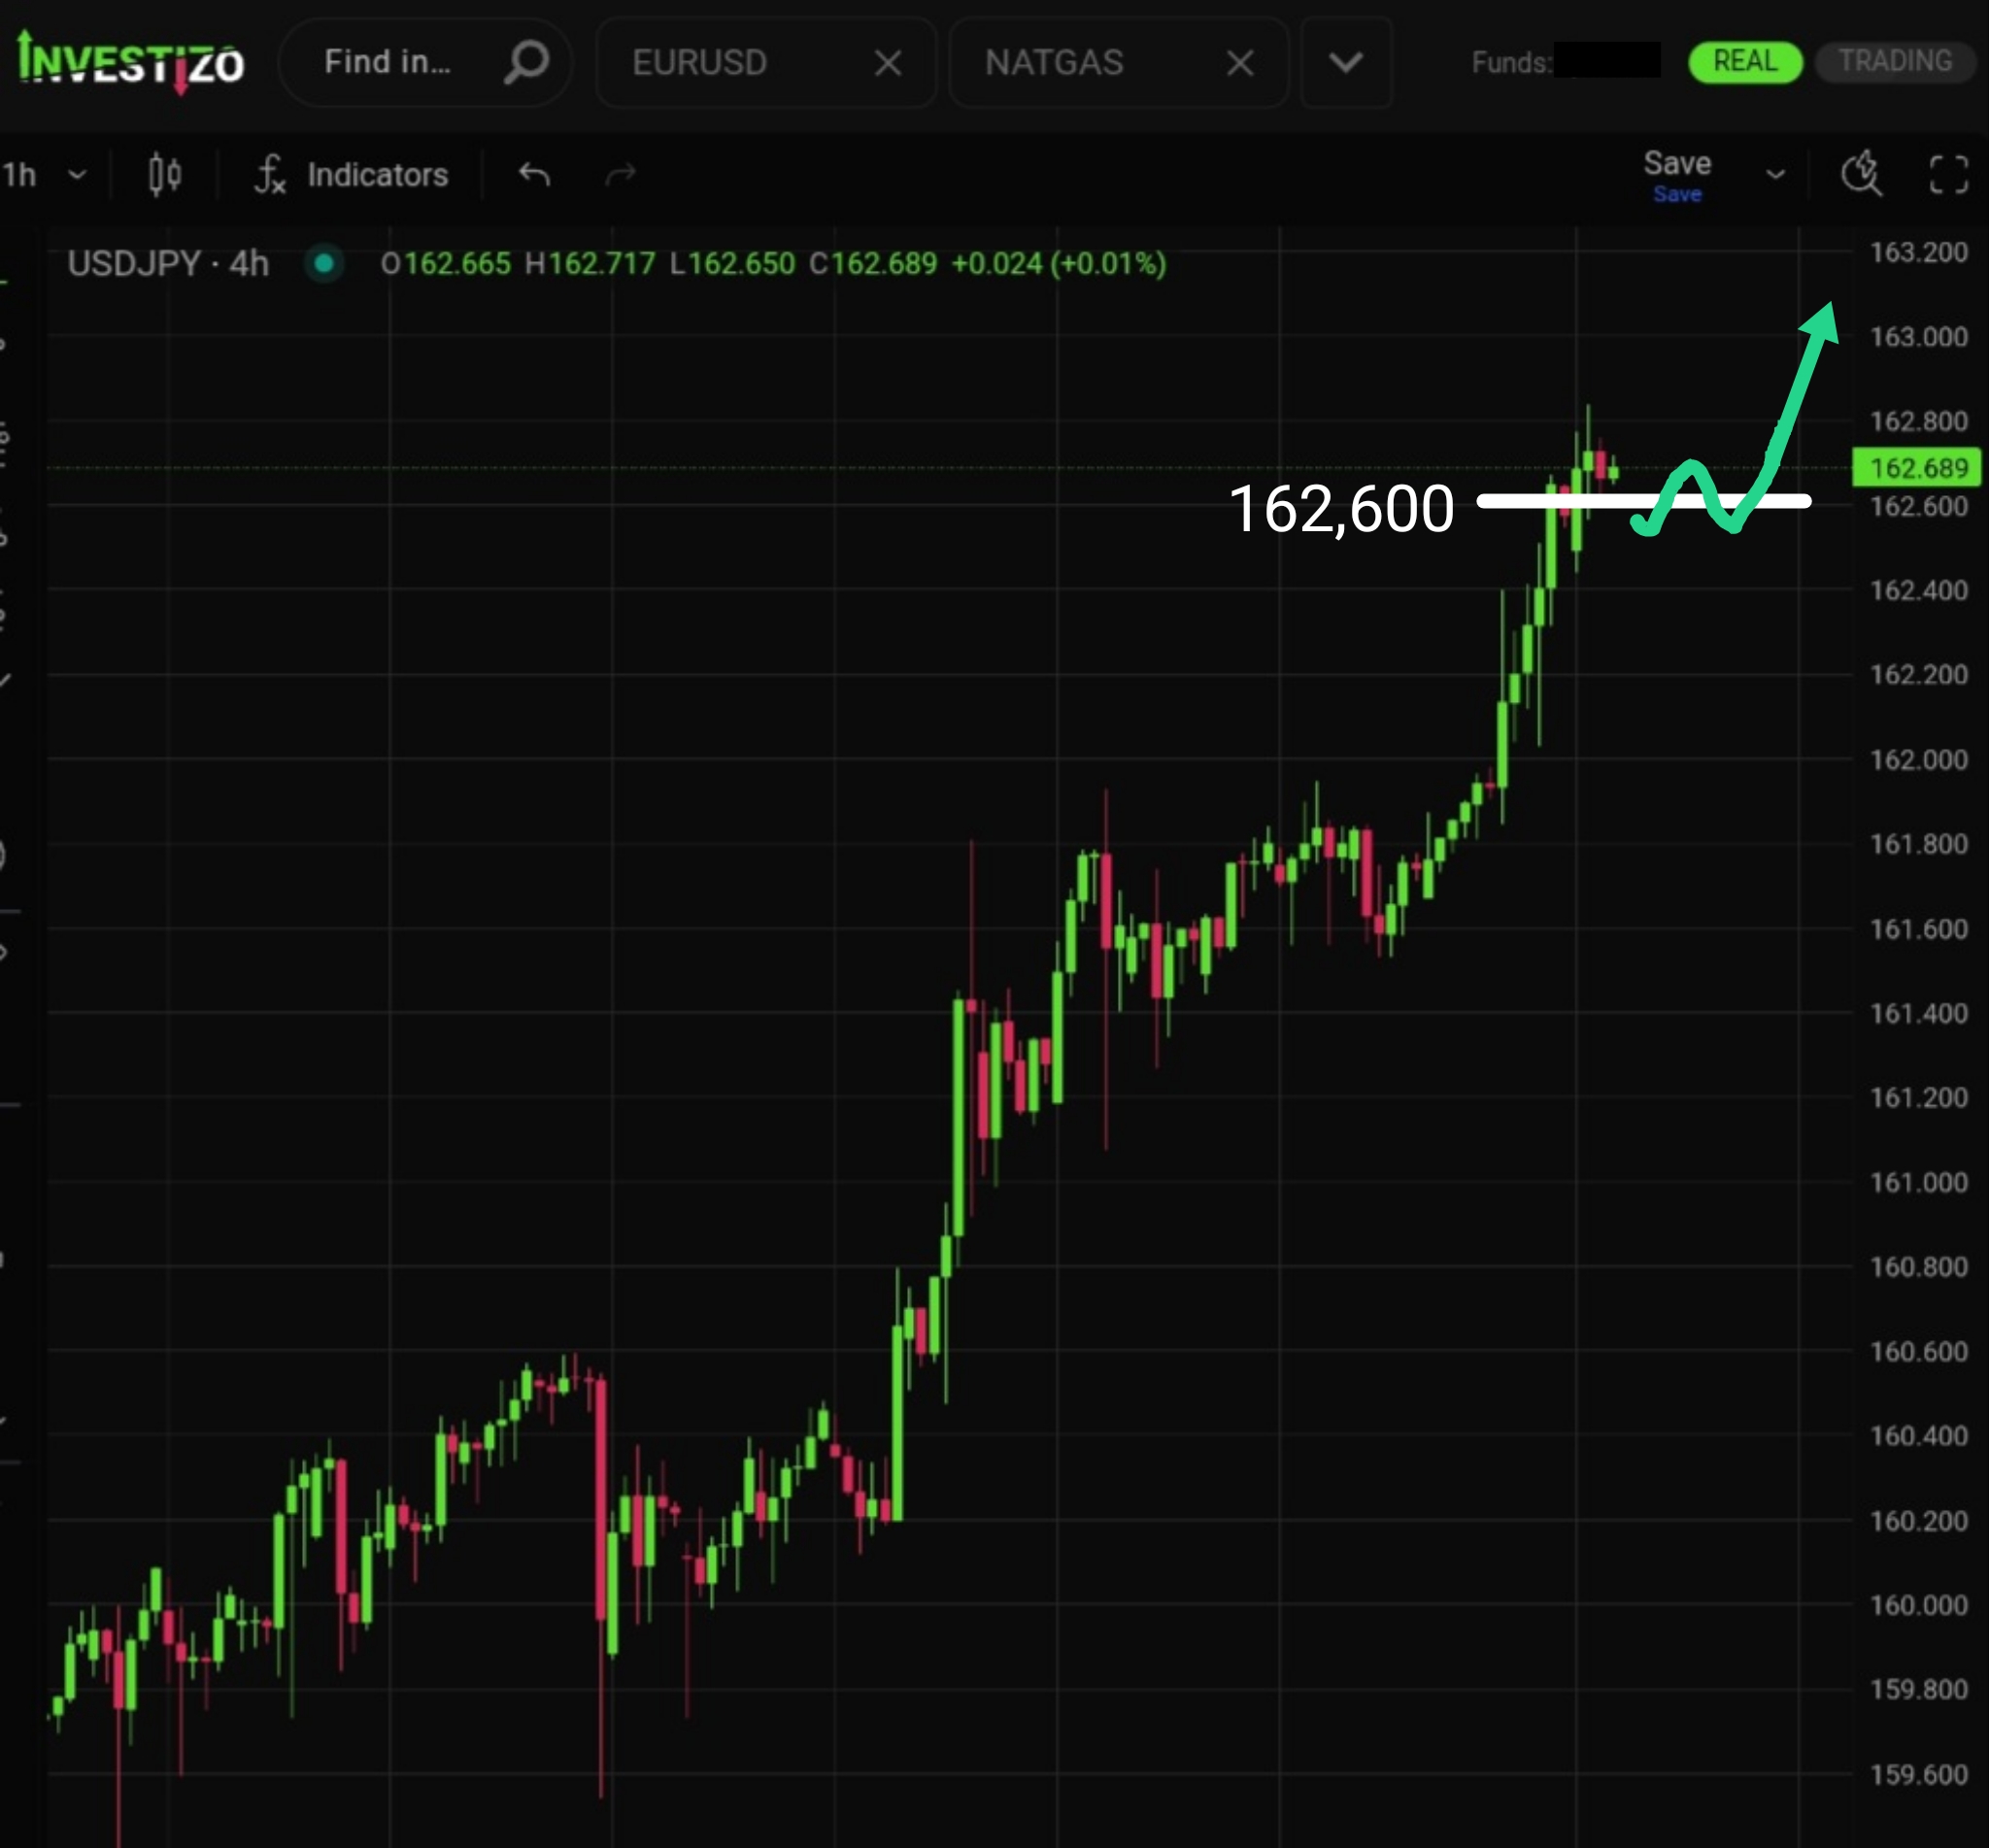
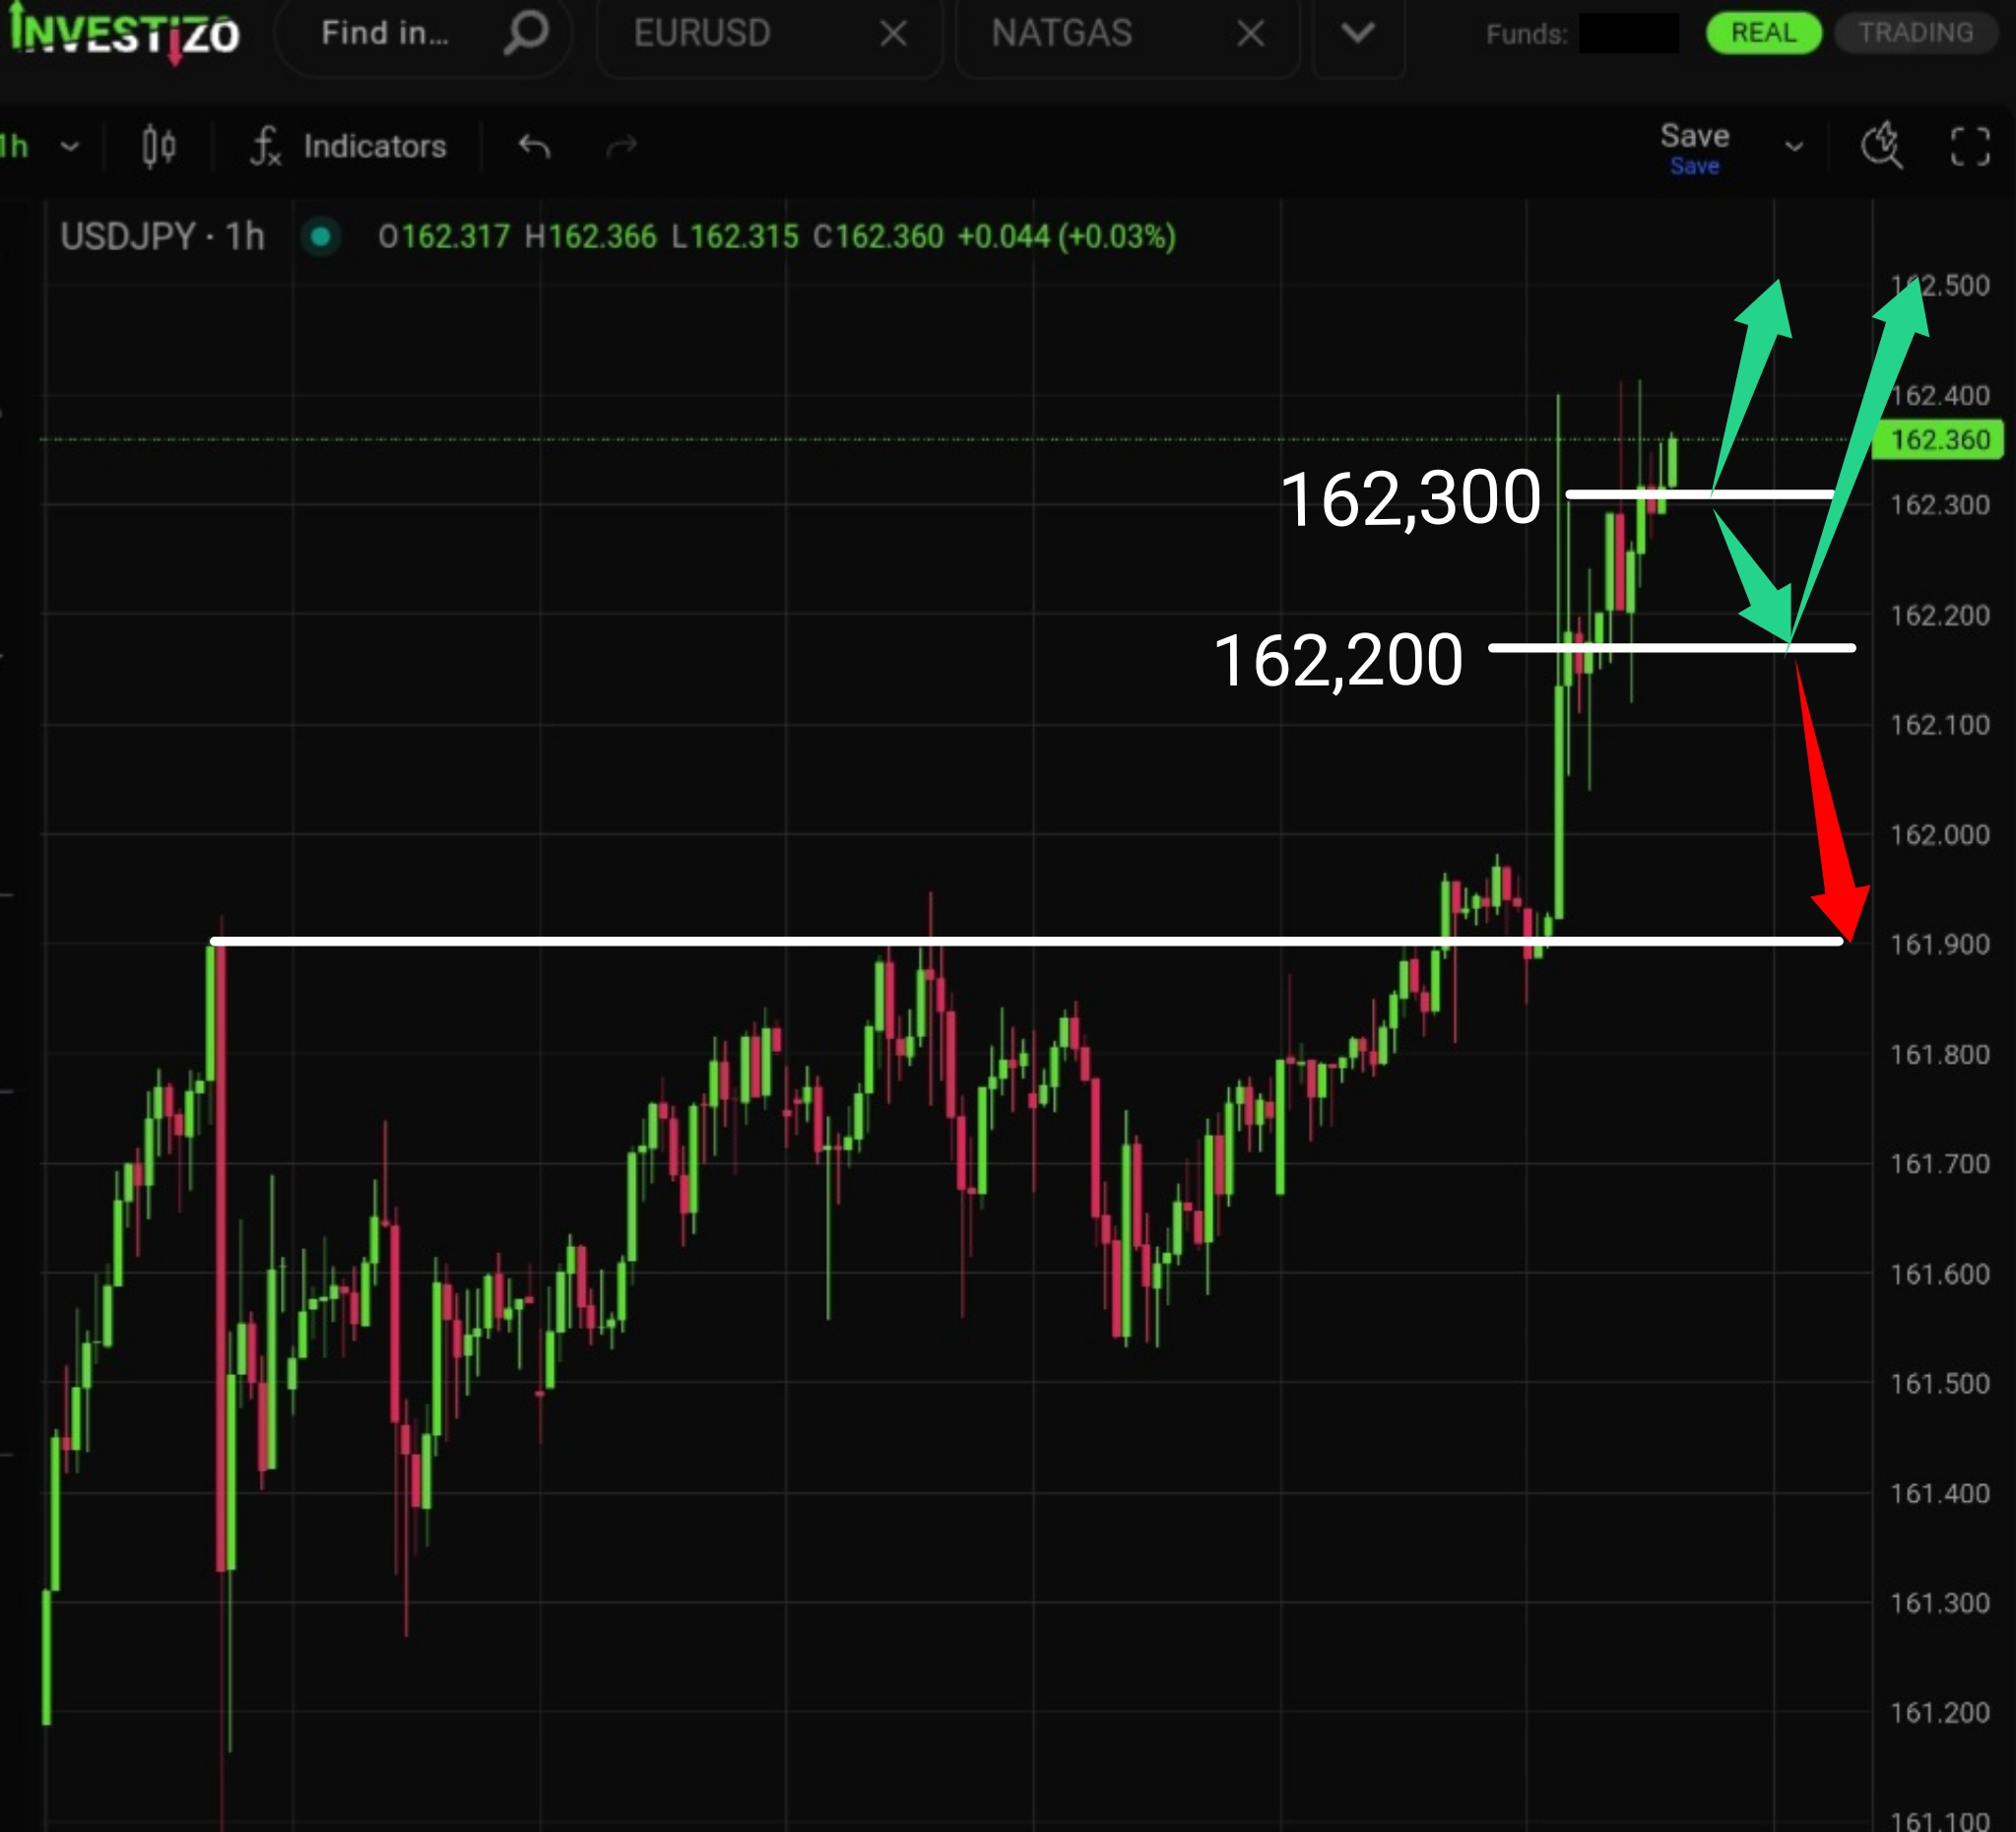
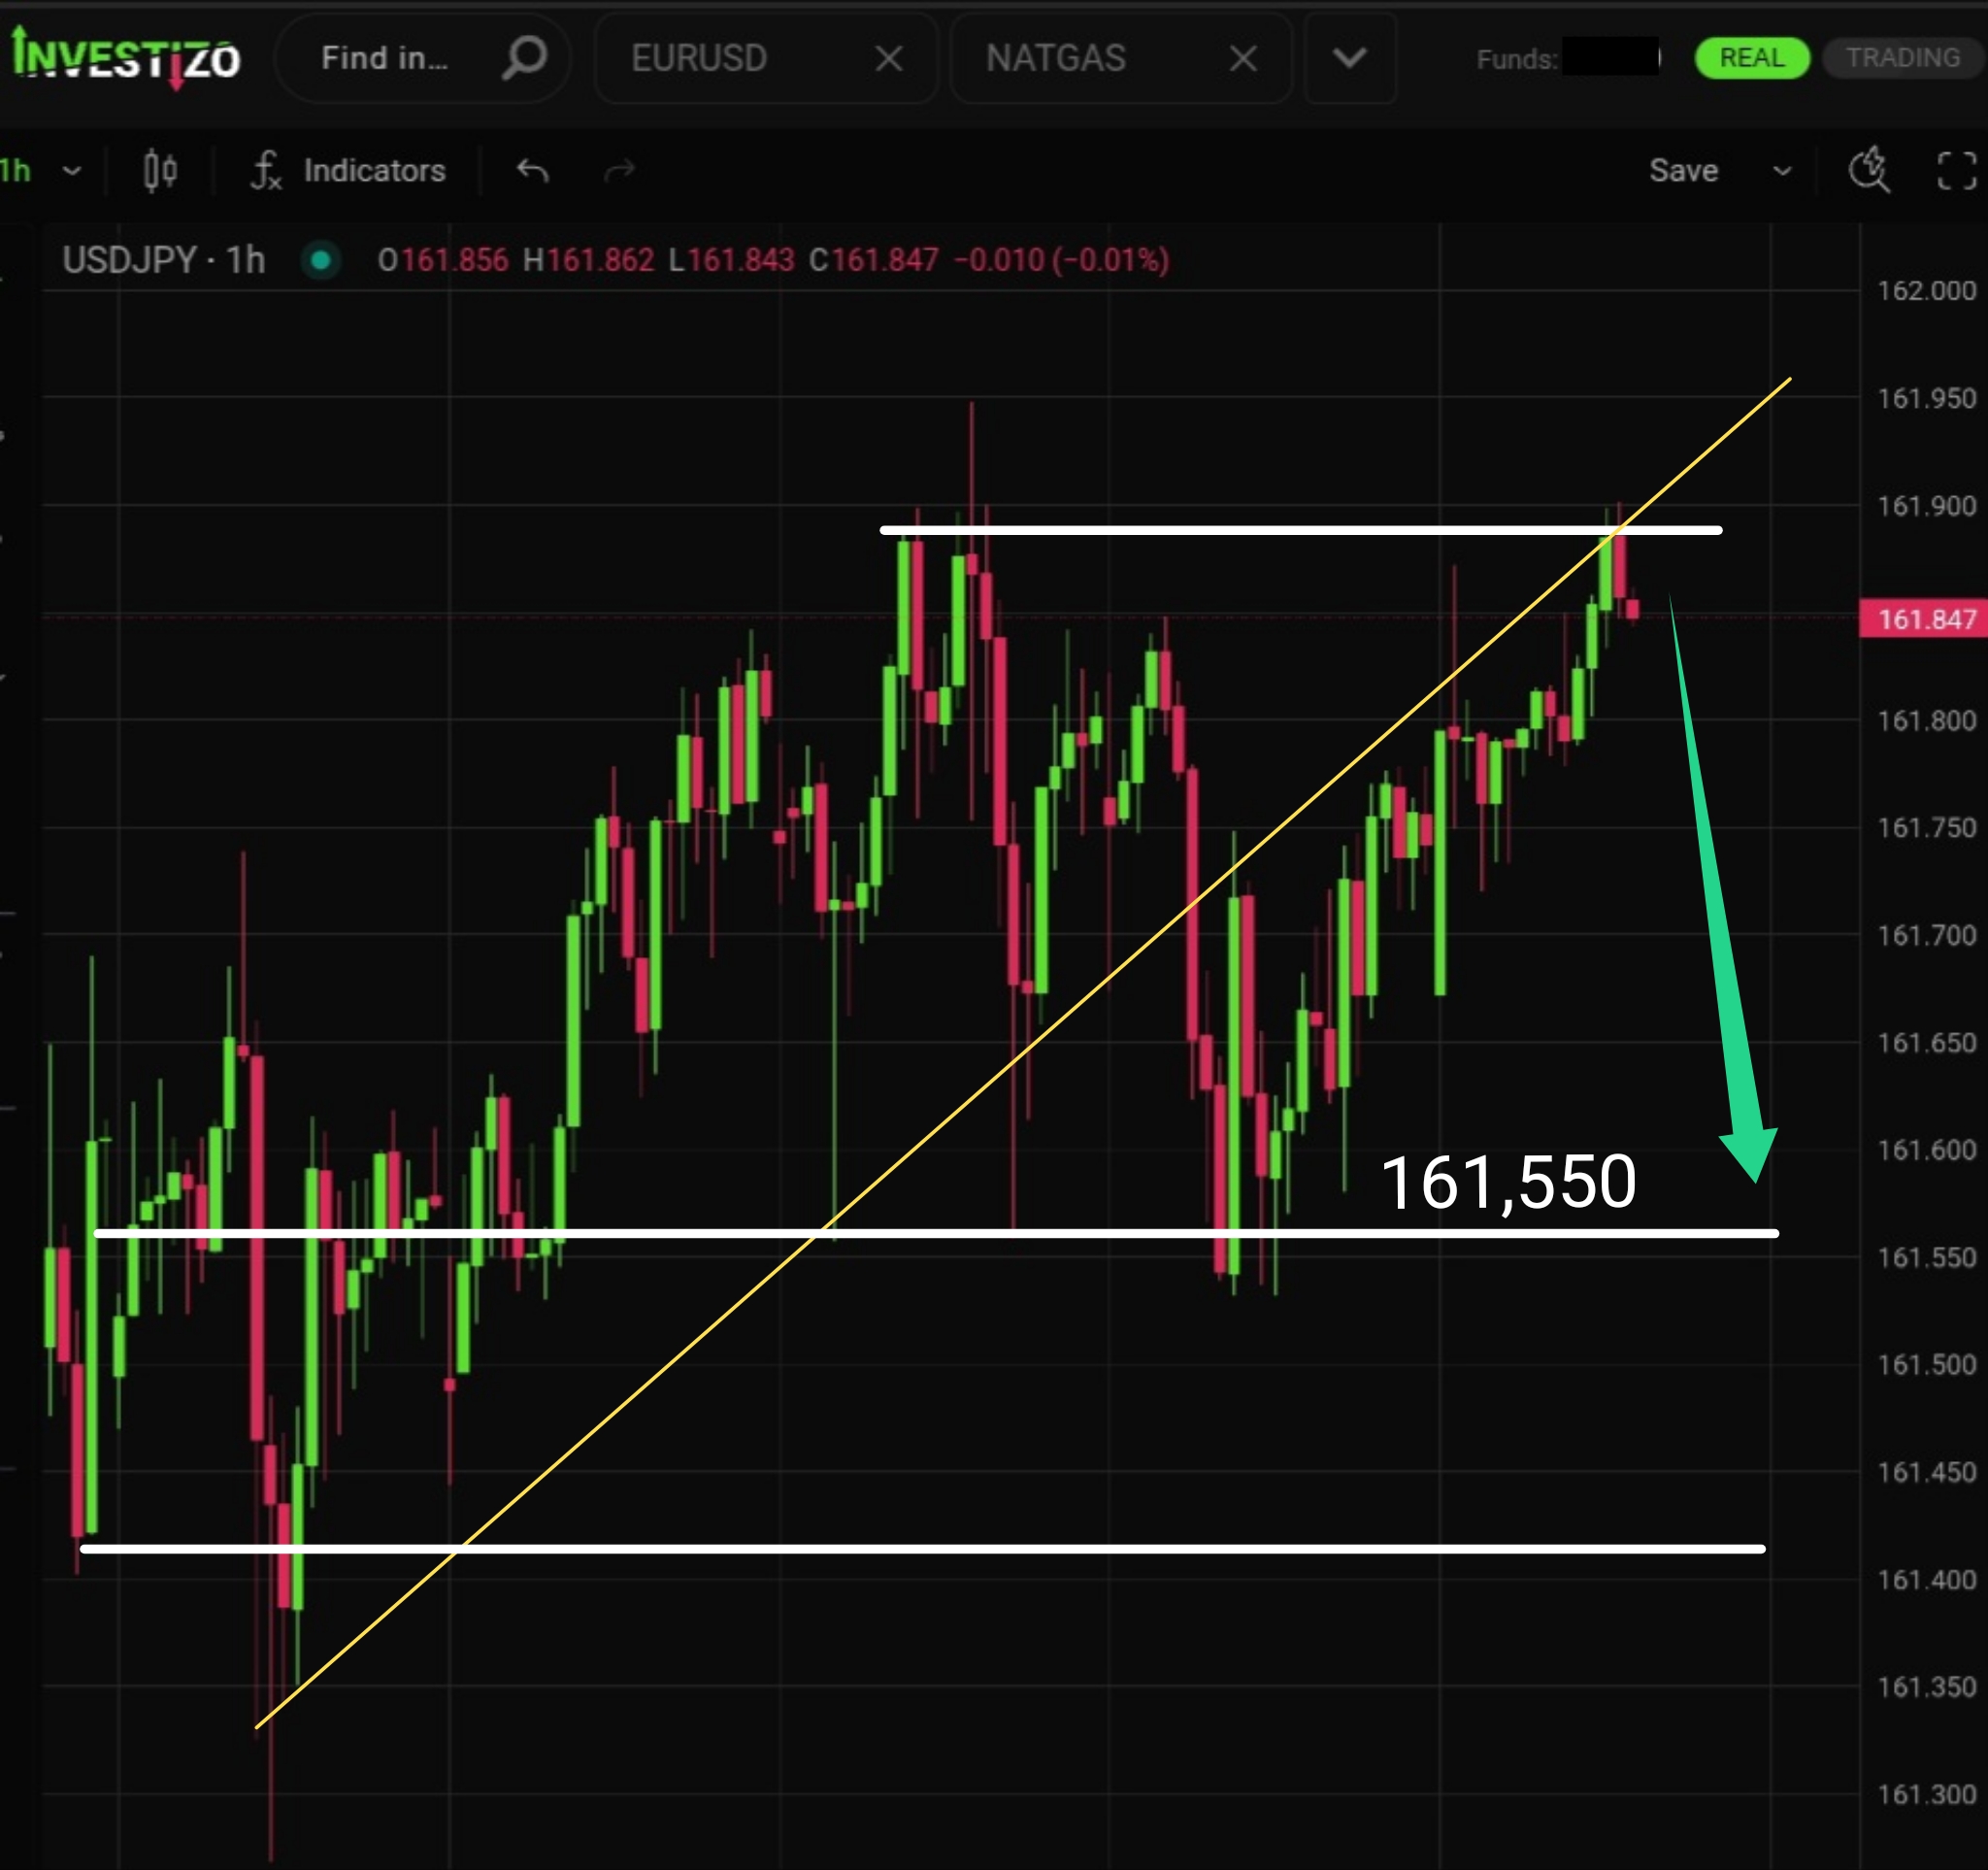
USD/JPY continues its broader uptrend on the H4 timeframe while approaching a key resistance zone. The price action suggests a potential pause before the next leg higher.
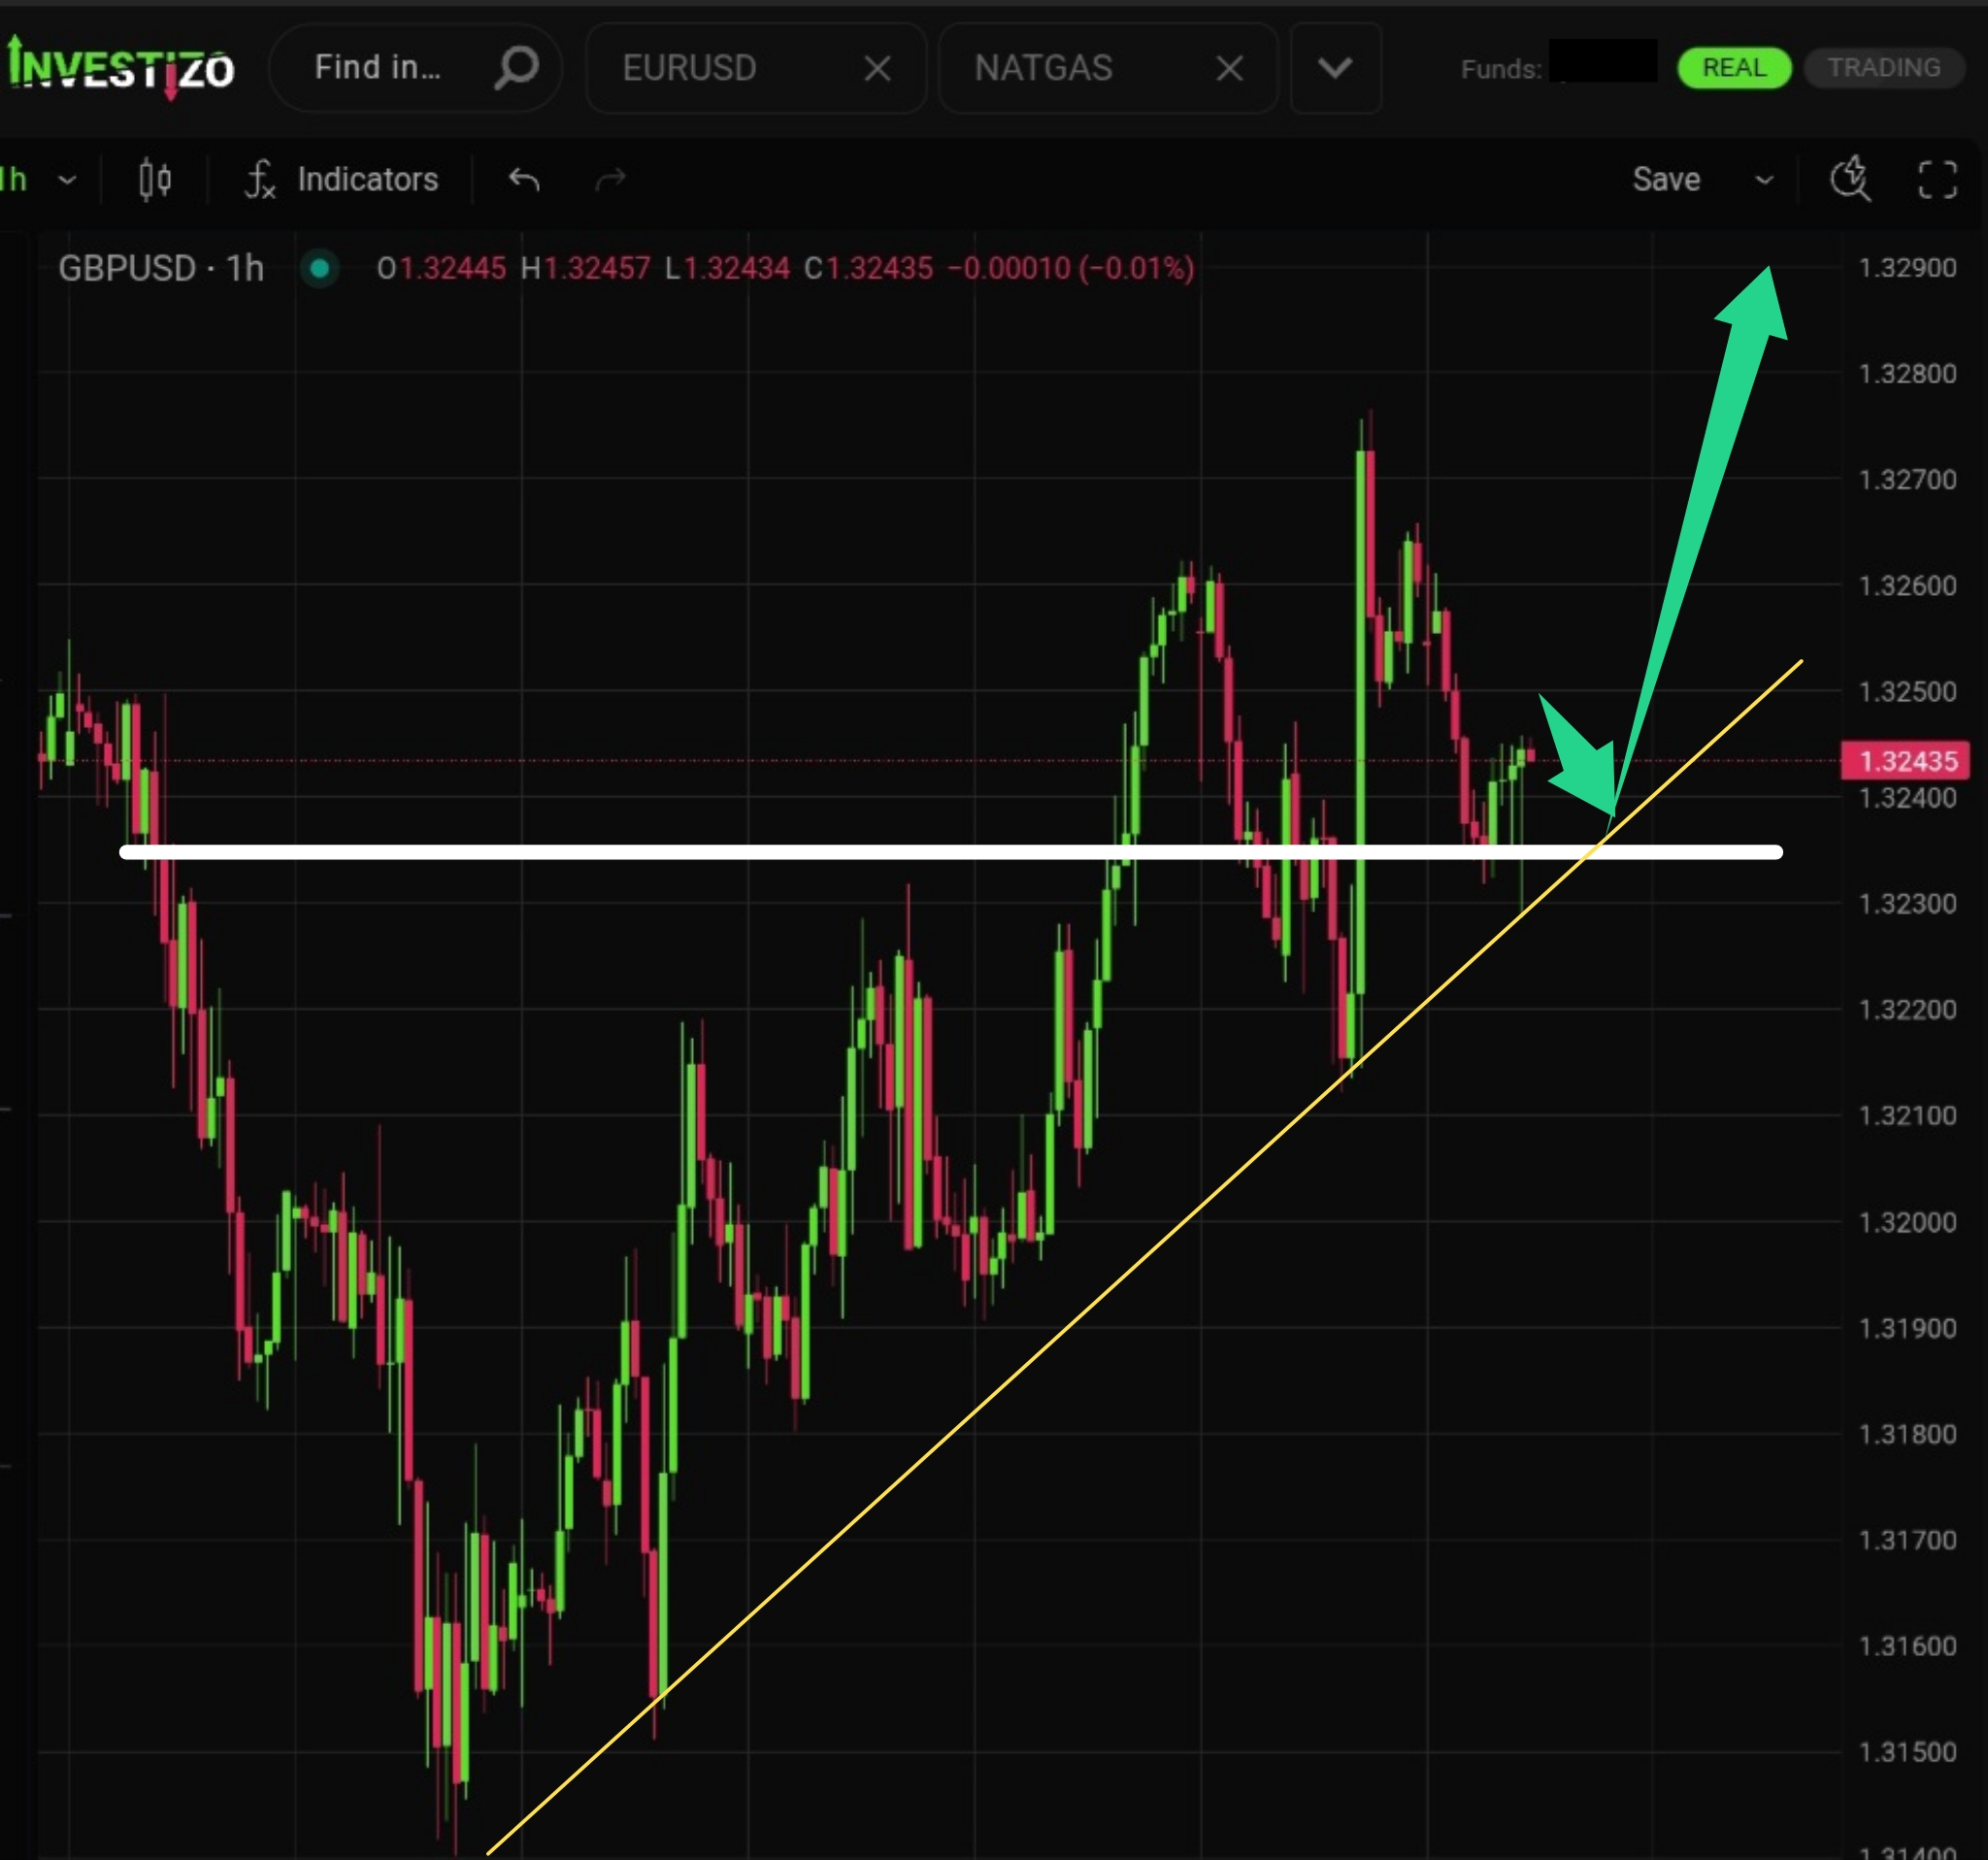
Bulls remain firmly in control on the H1 timeframe, successfully defending the local trendline support. The pair is showing signs of building momentum for the next upside leg.
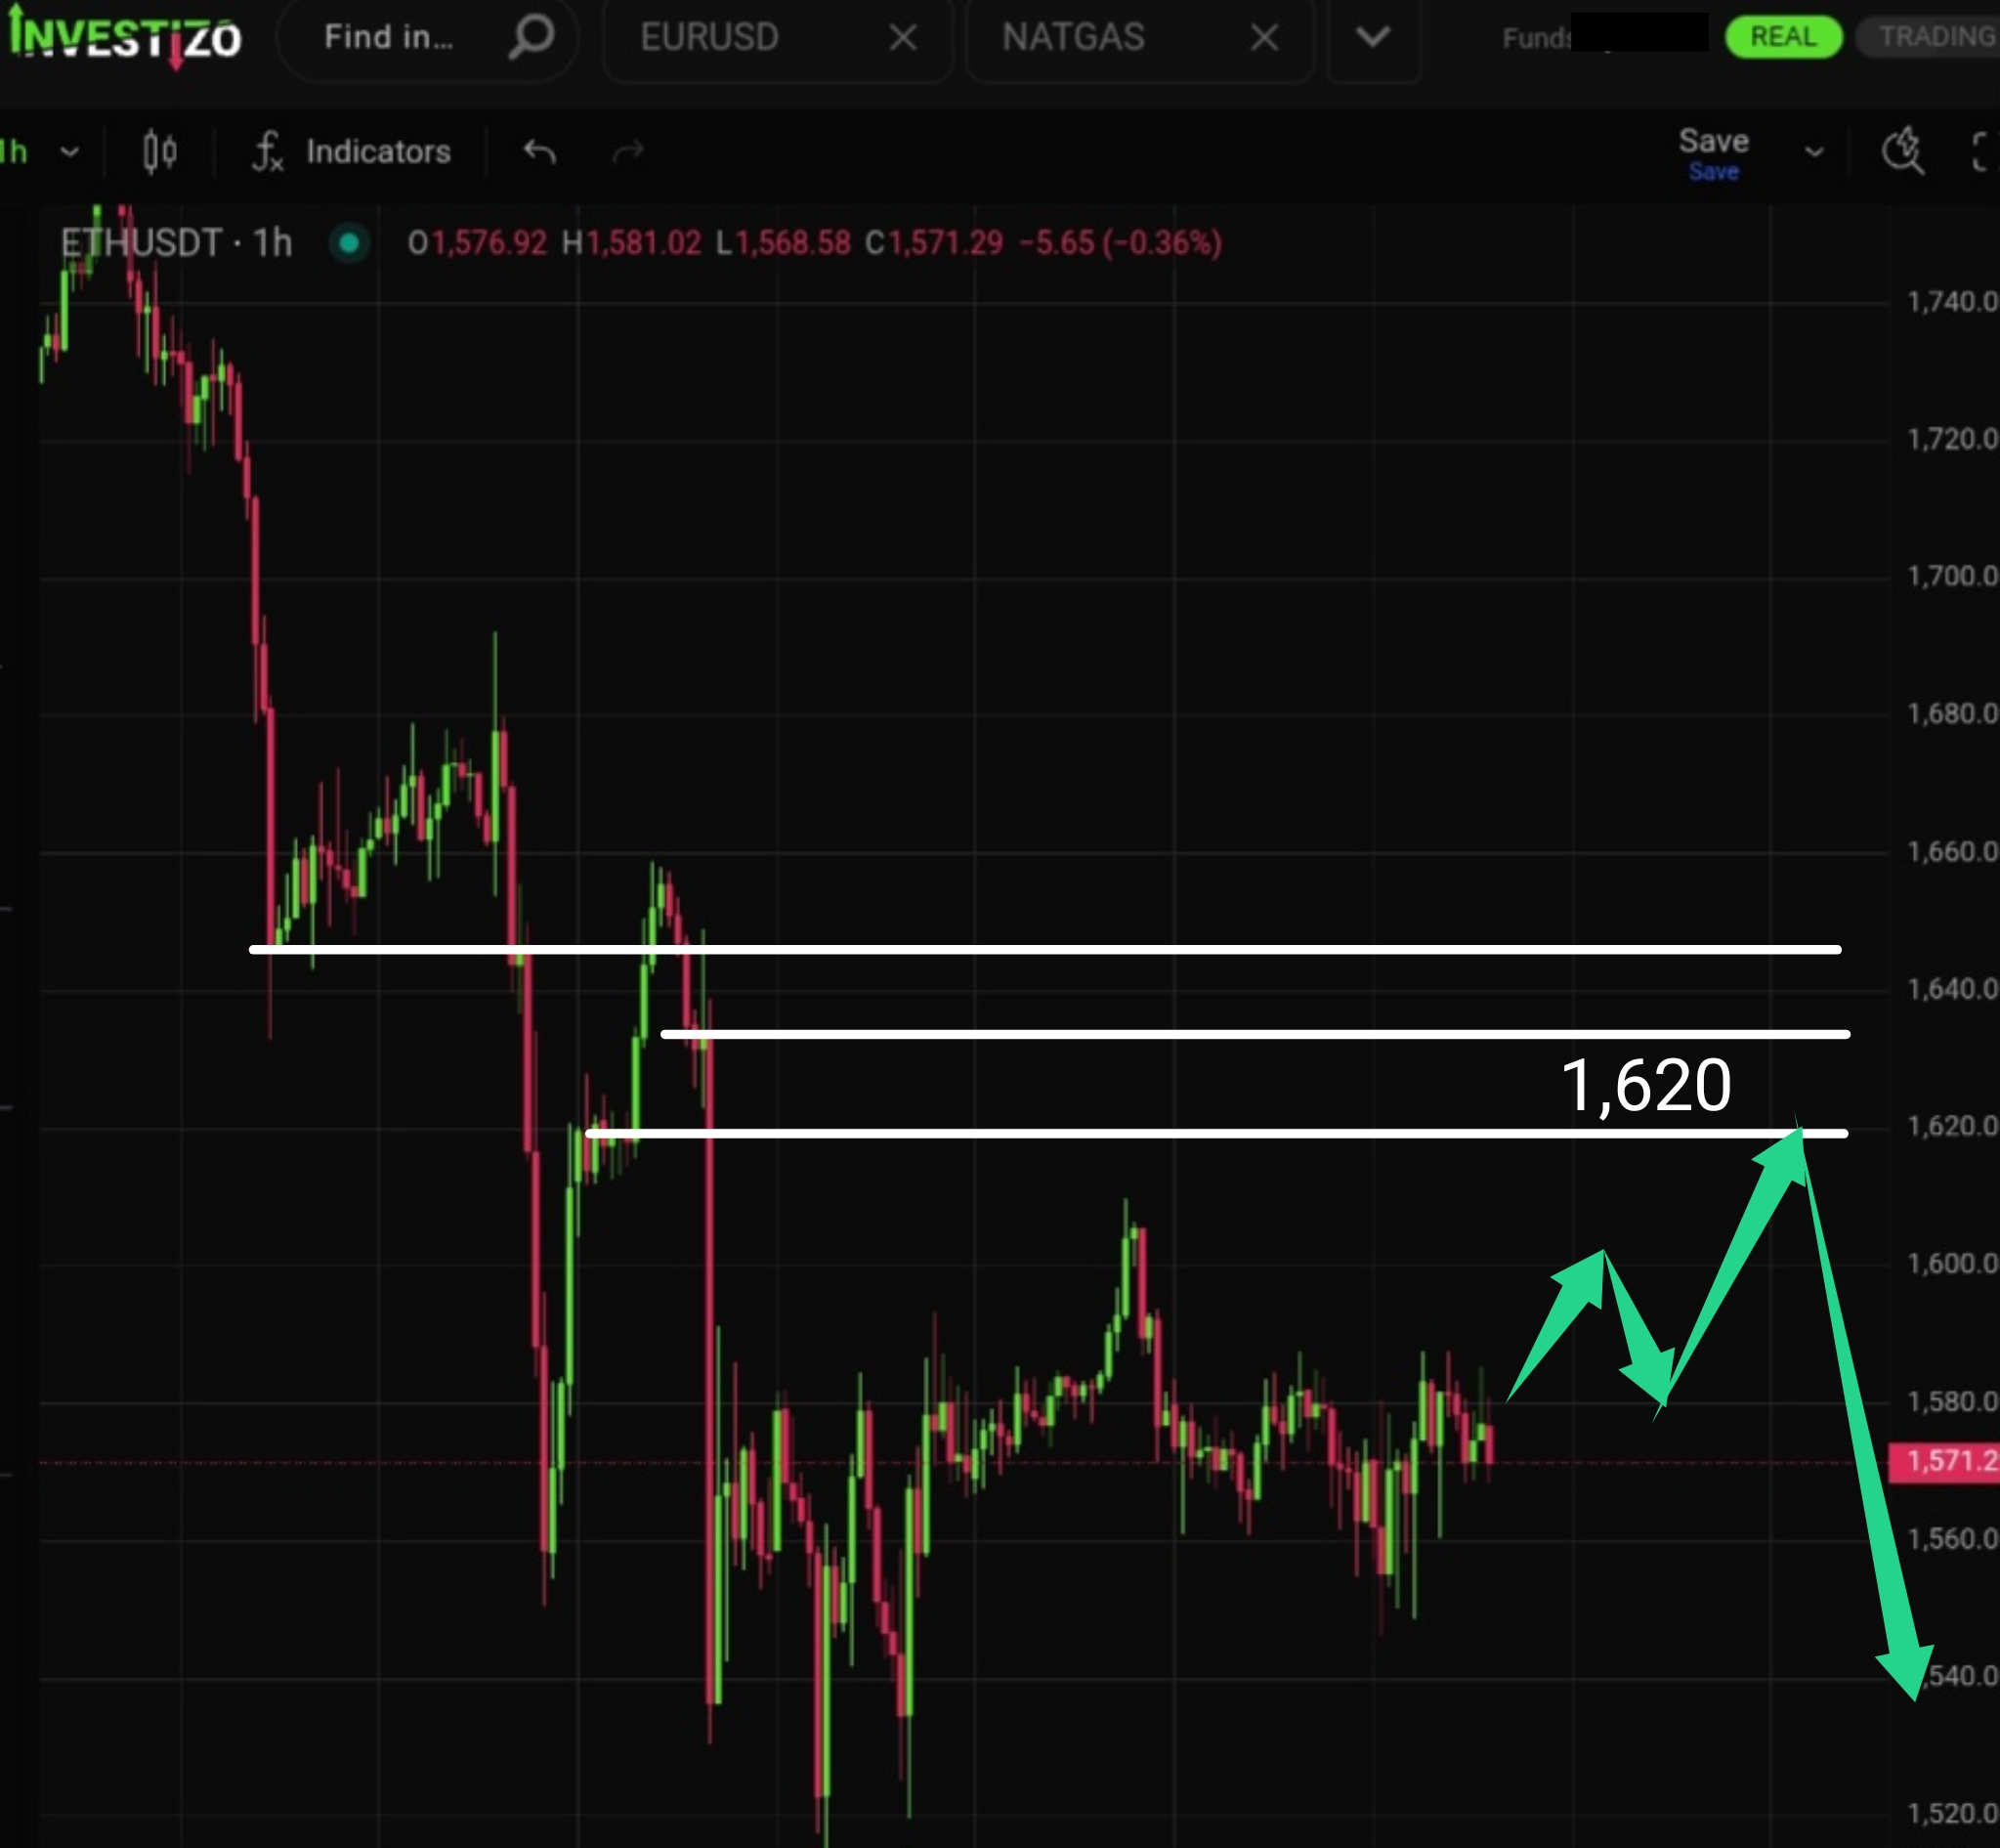
Despite sharp local corrective bounces fueled by buyers defending round-number support levels, the asset continues to exhibit overall weakness and distinctly bearish momentum.
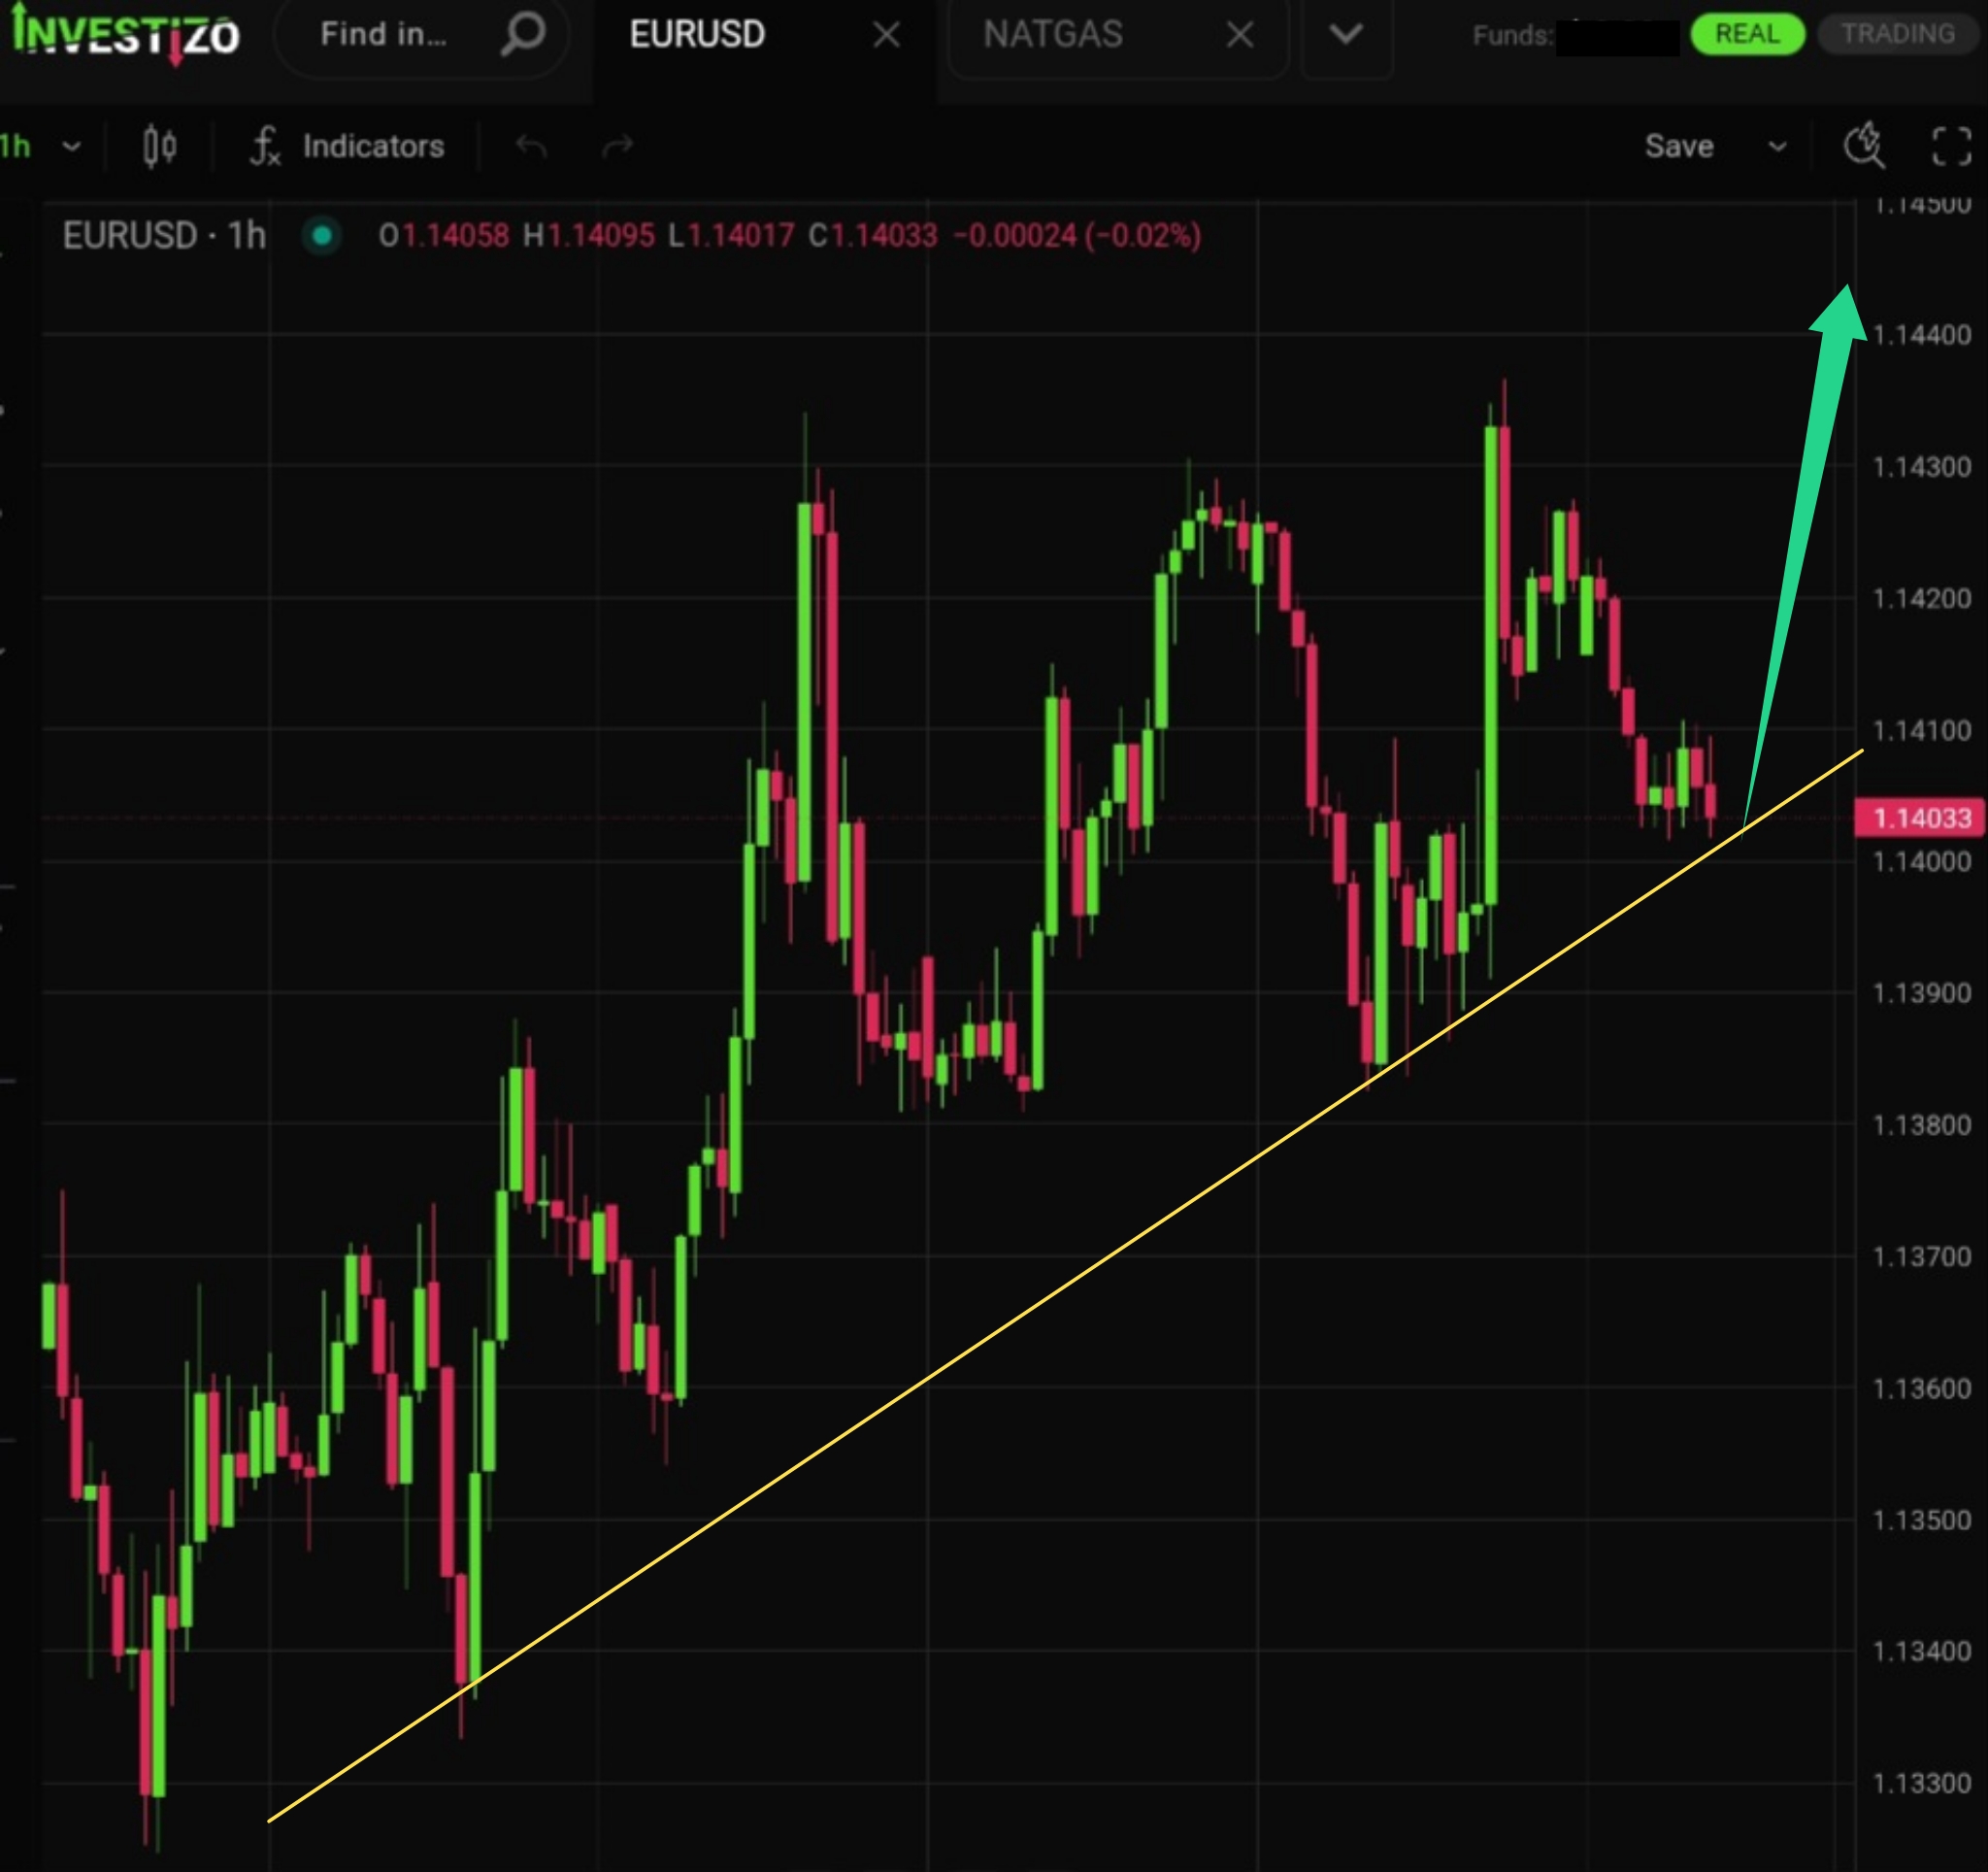
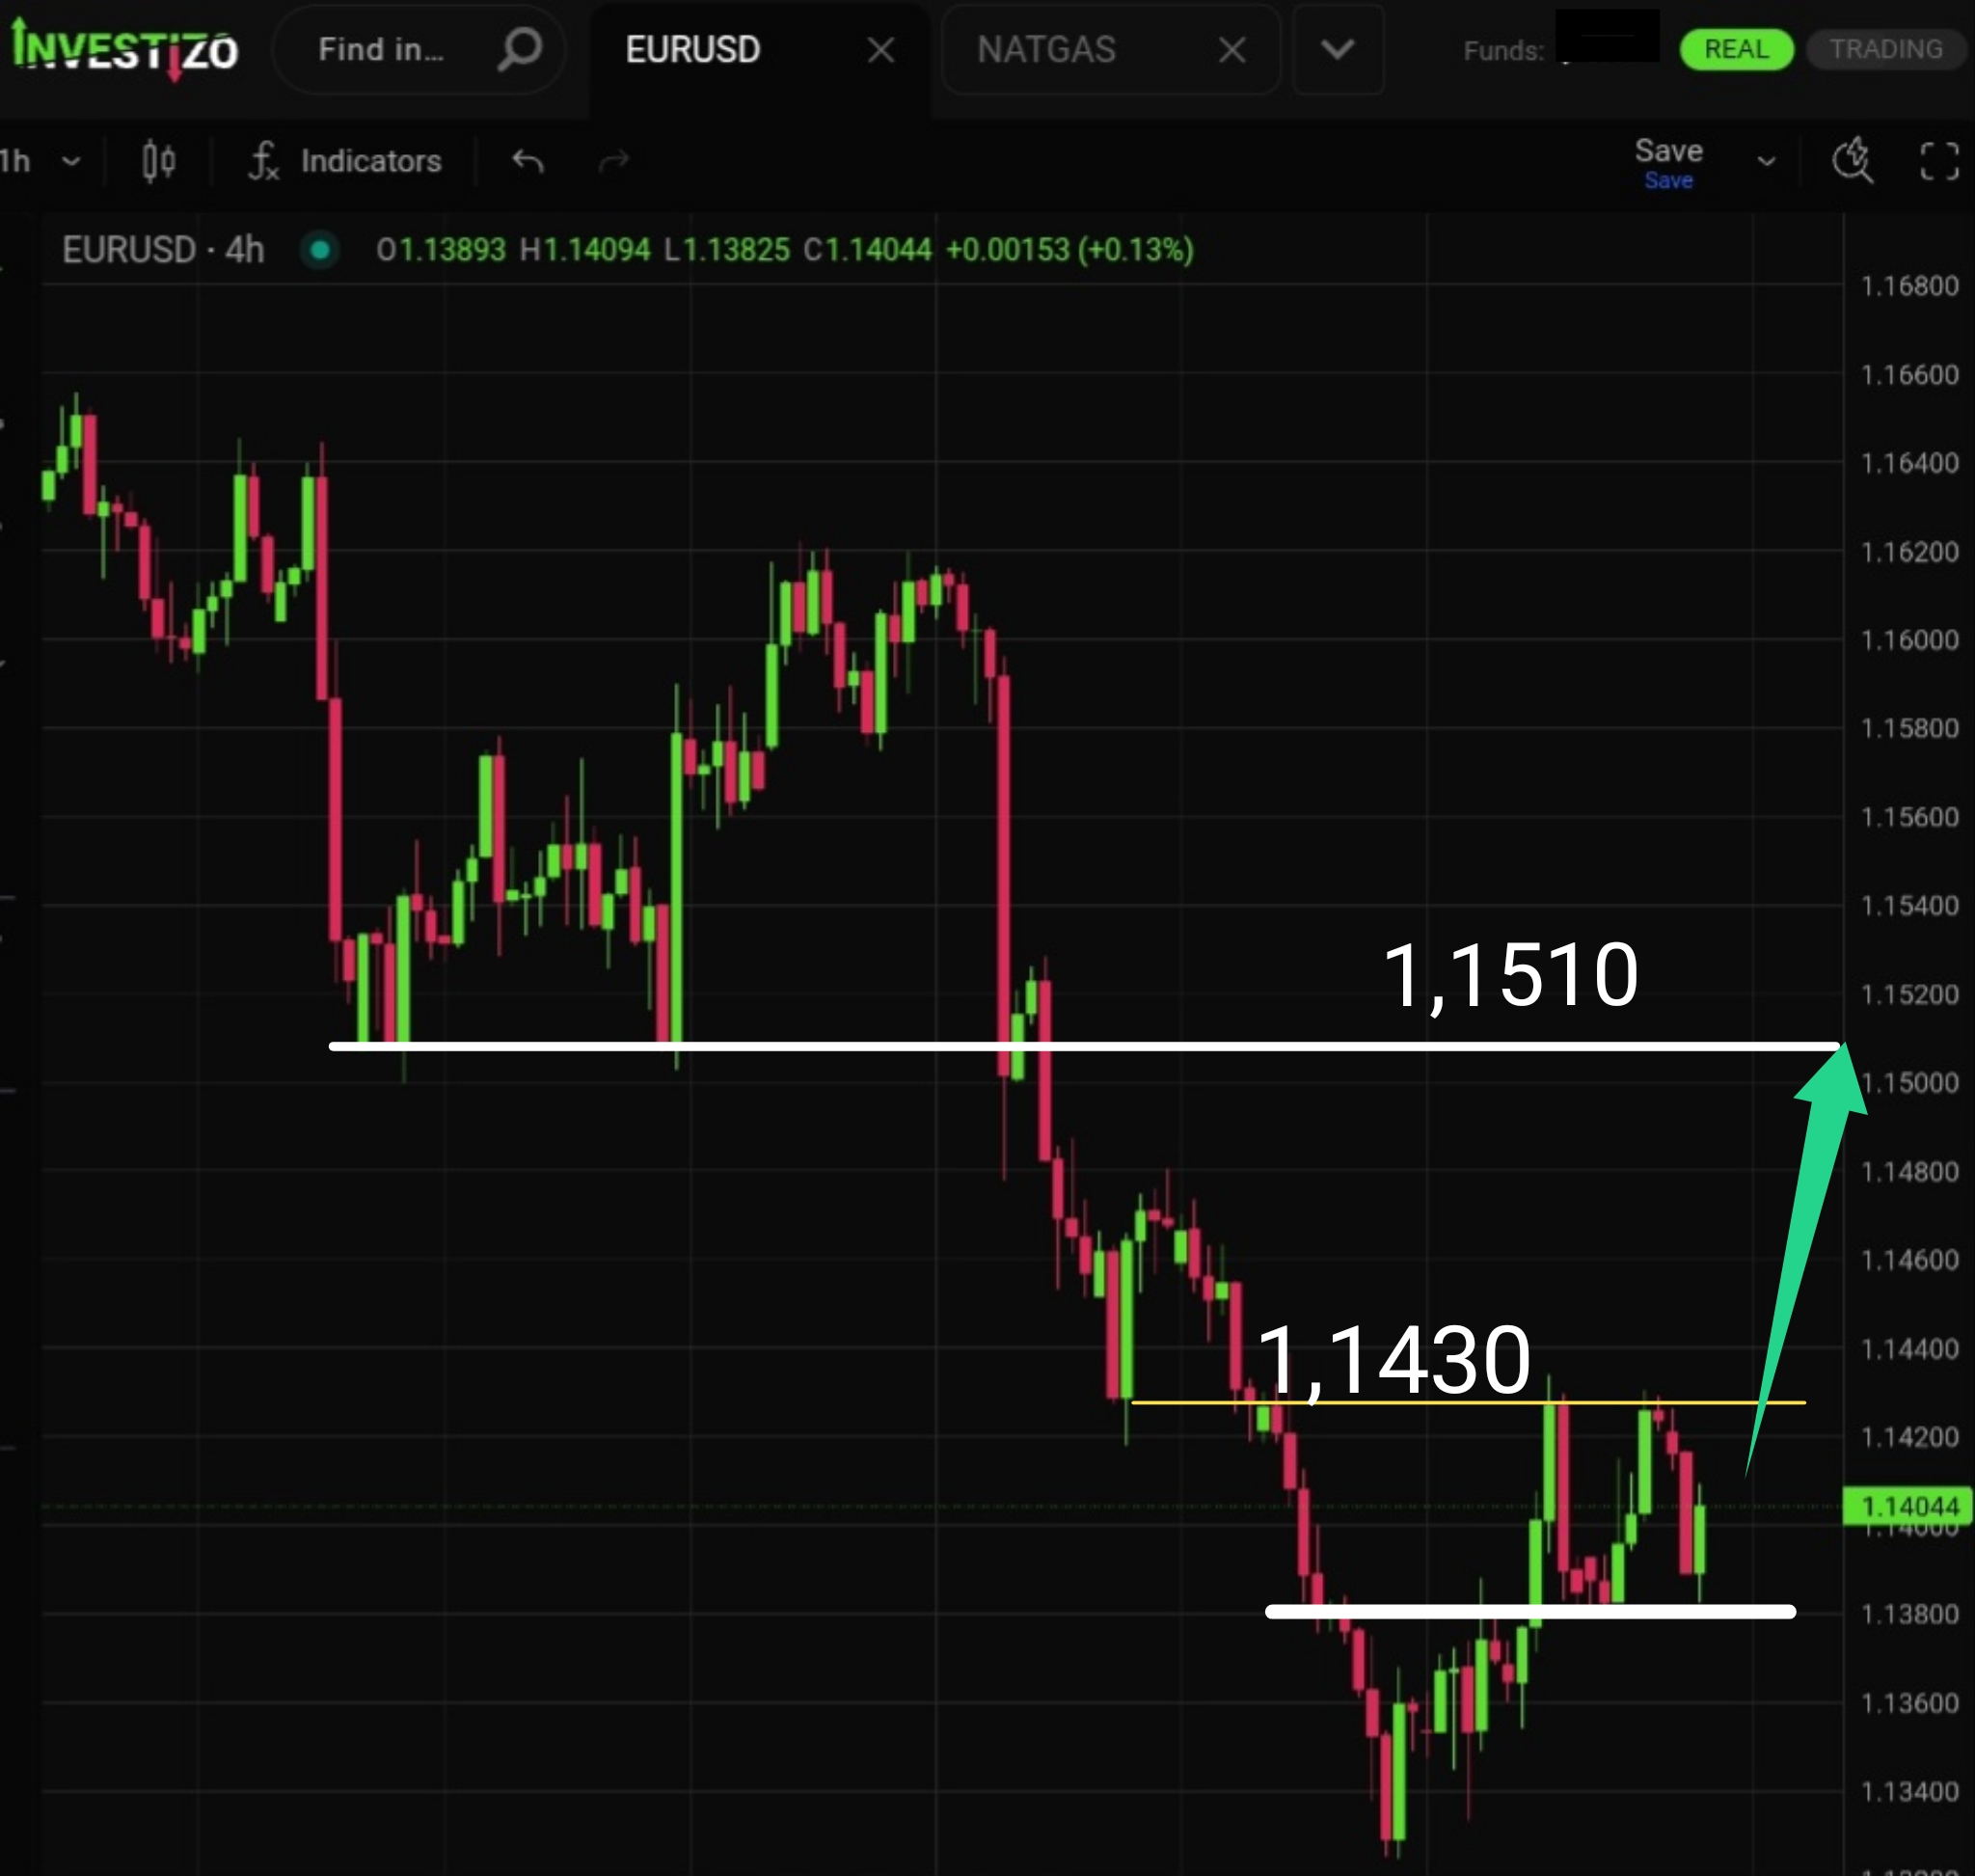
EUR/USD starts the morning session consolidating near 1.1400, experiencing localized pressure amid broad-based greenback strength across global markets.
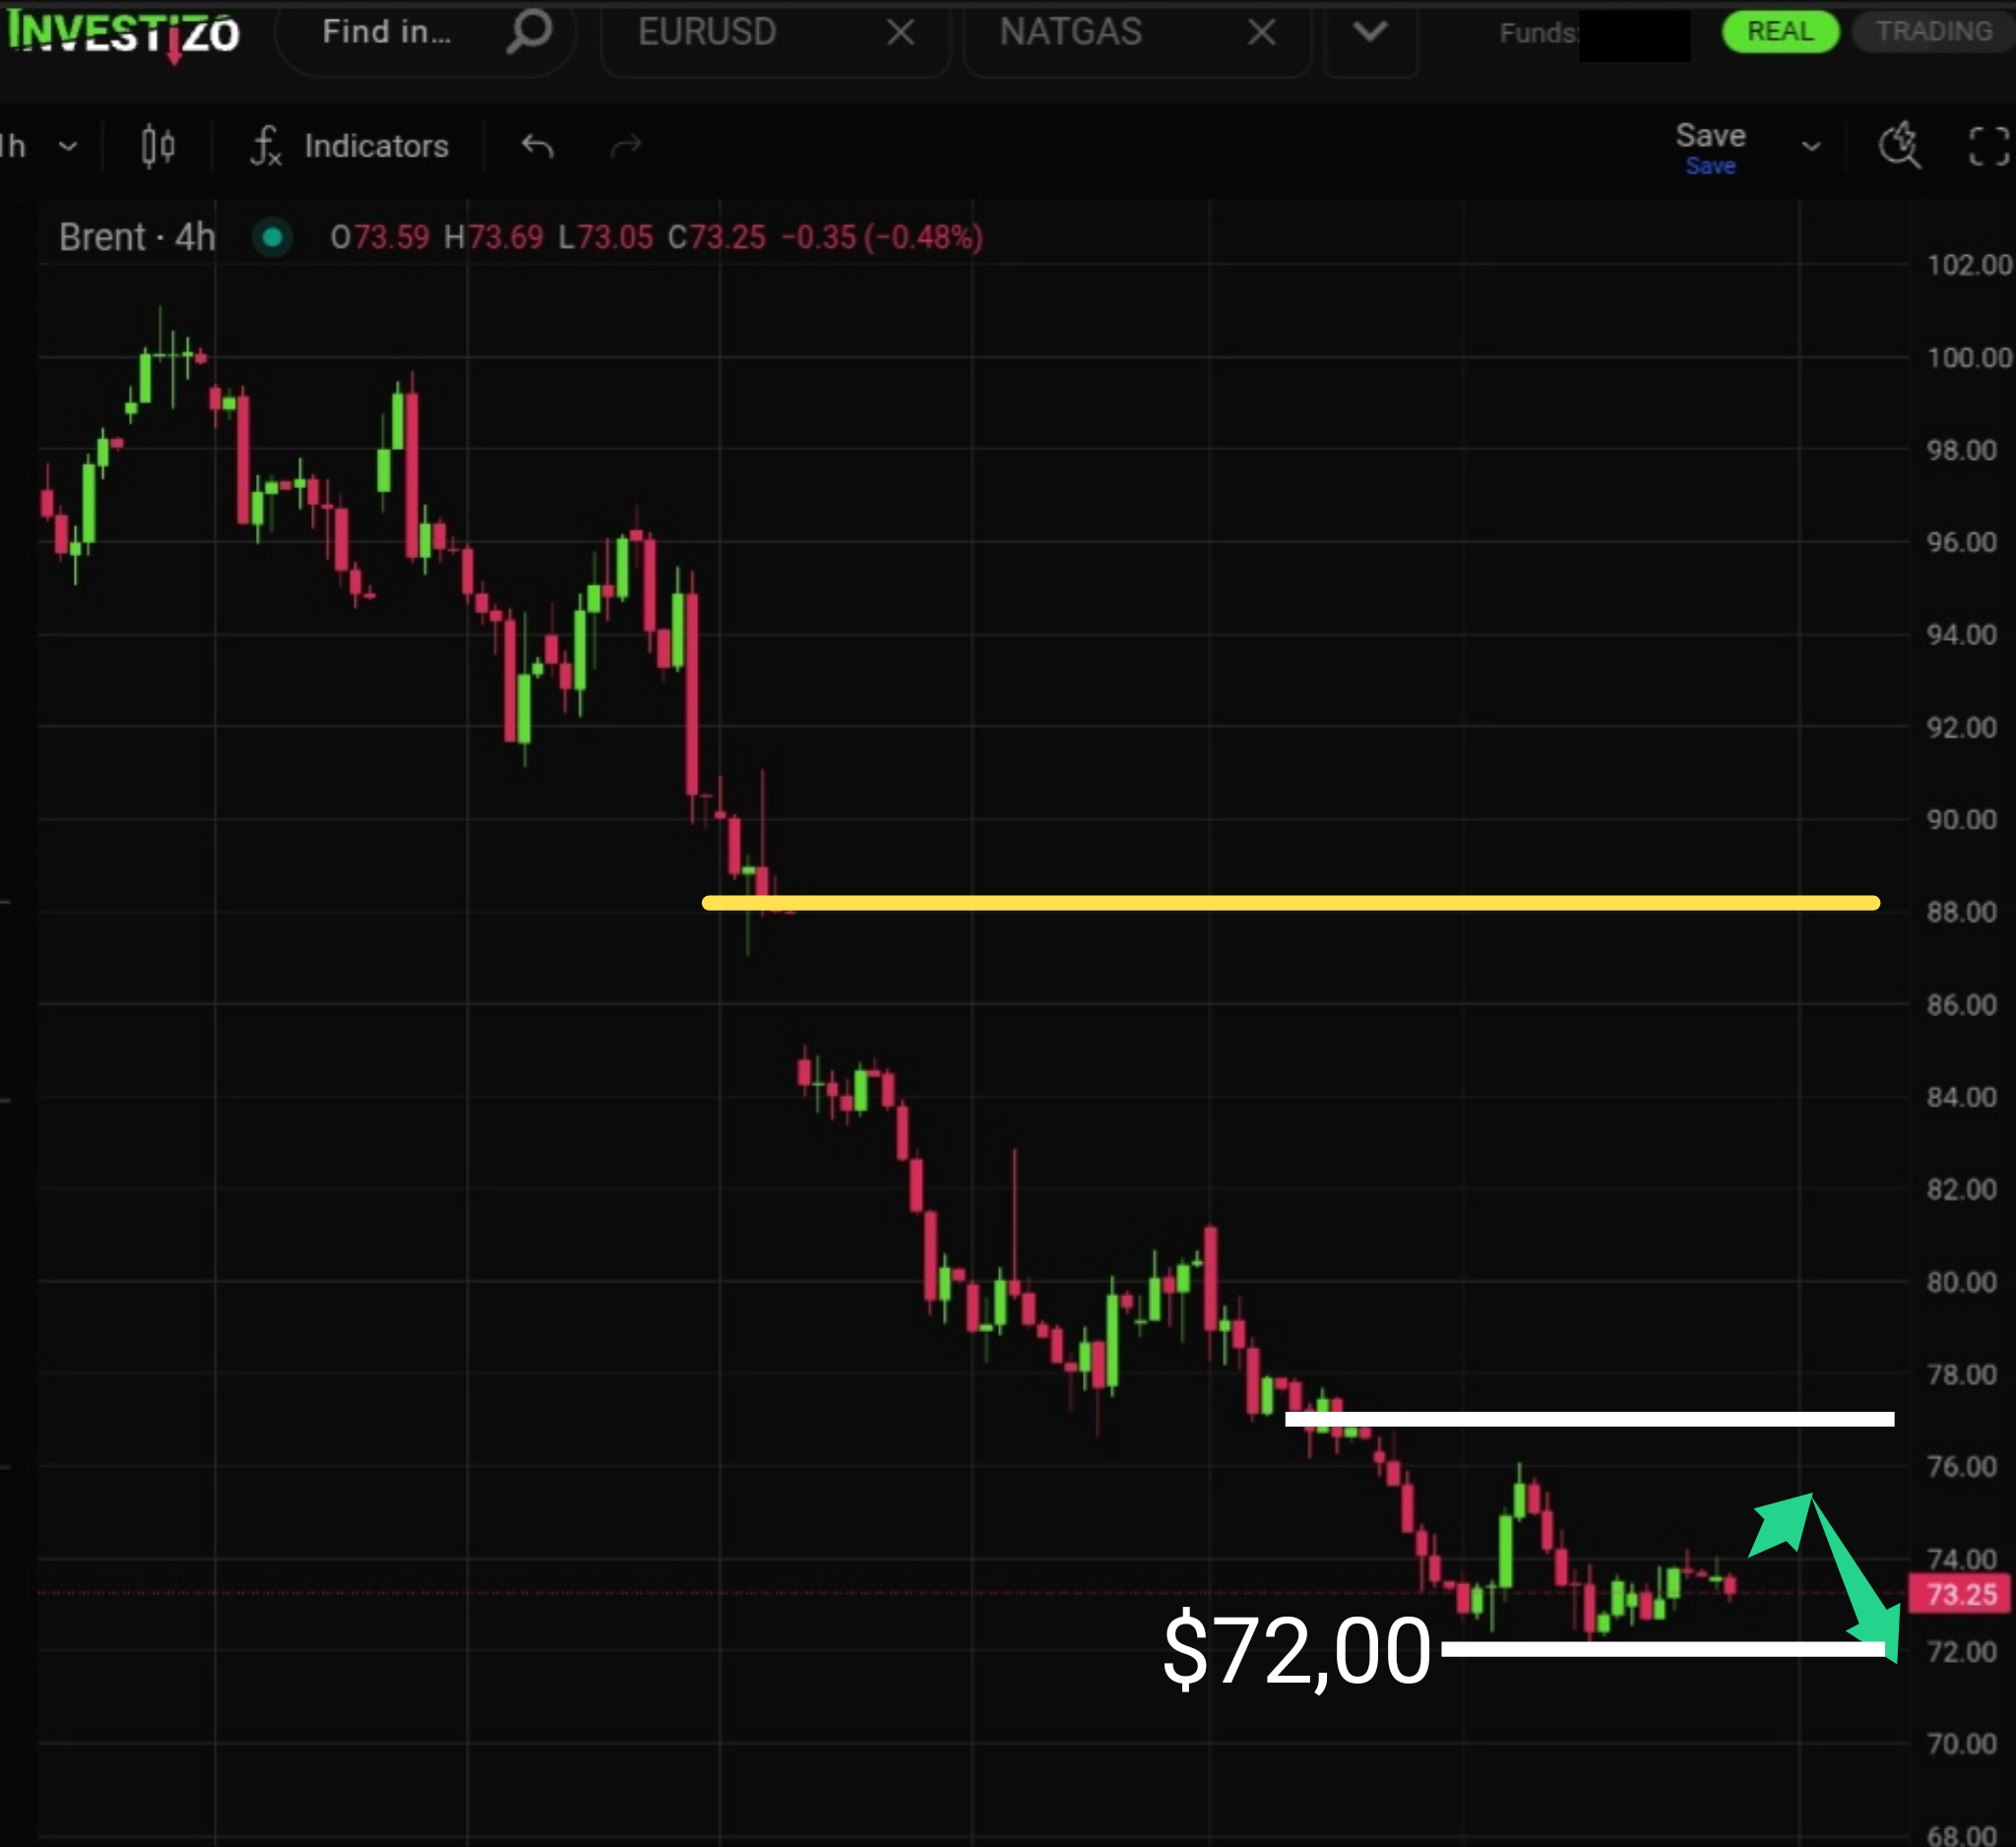
Brent Crude starts the morning session stabilizing at $73.00 after the closing bell finalized oil's sharpest quarterly decline in six years.
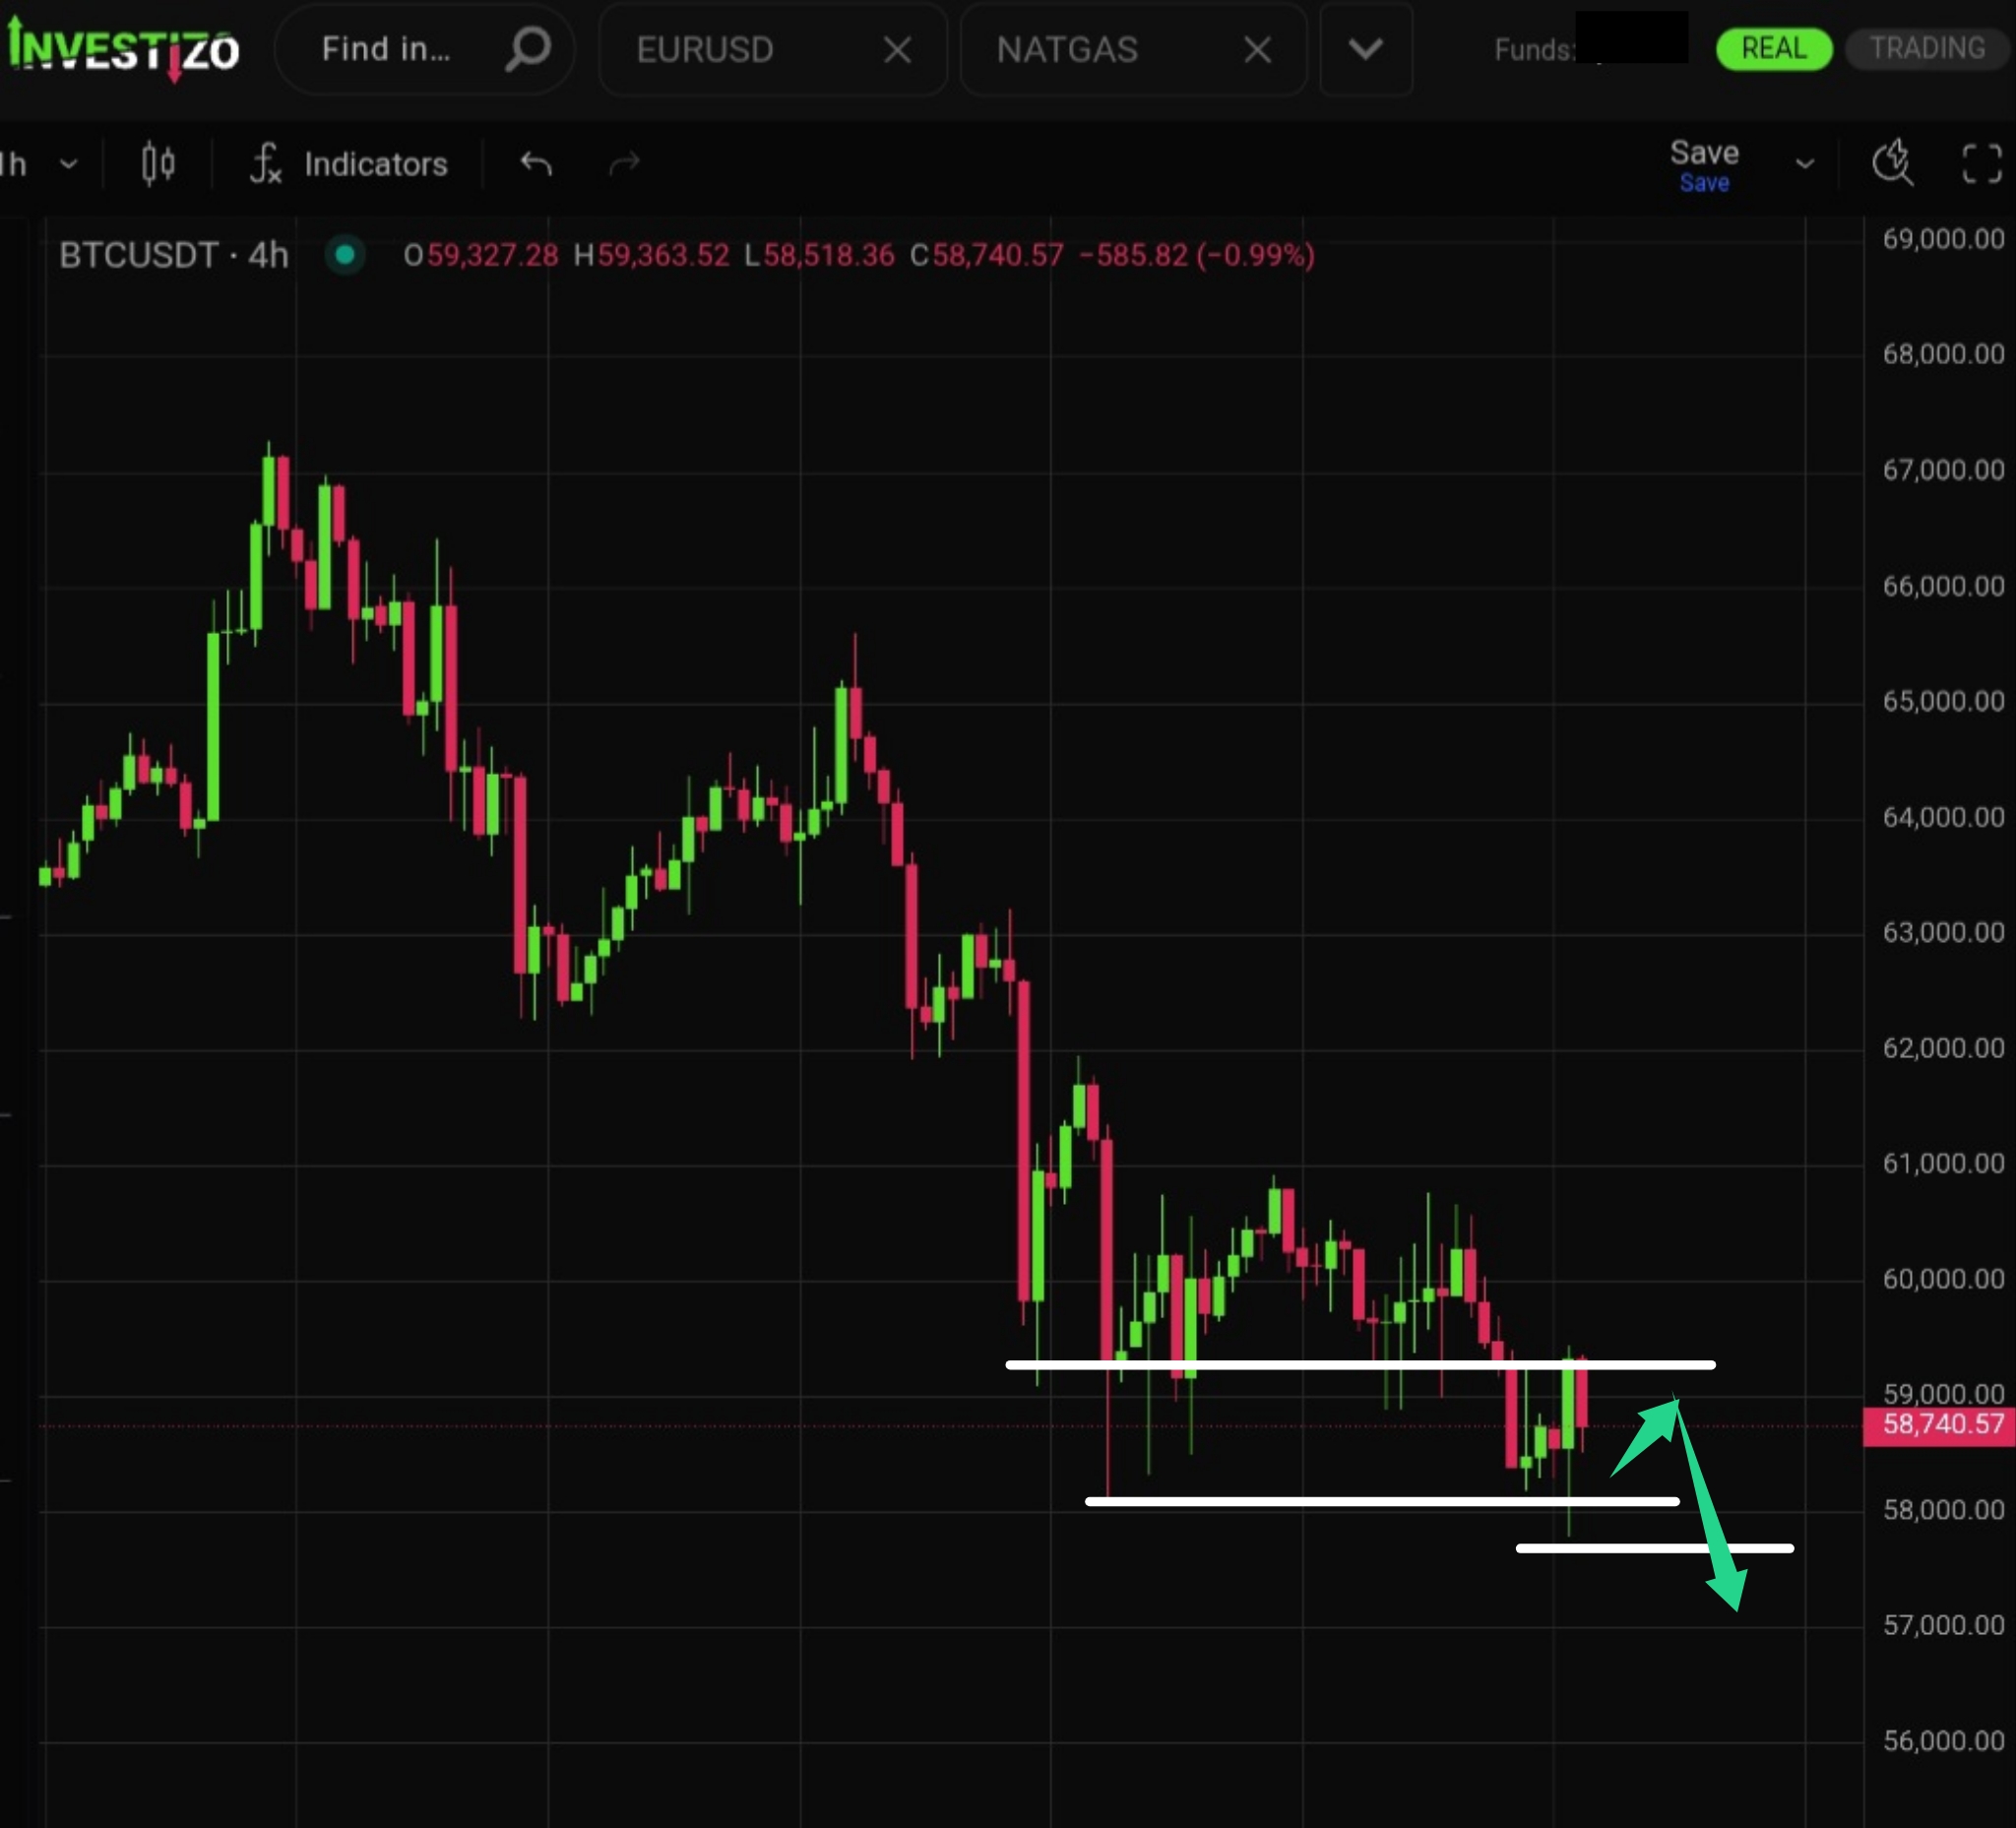
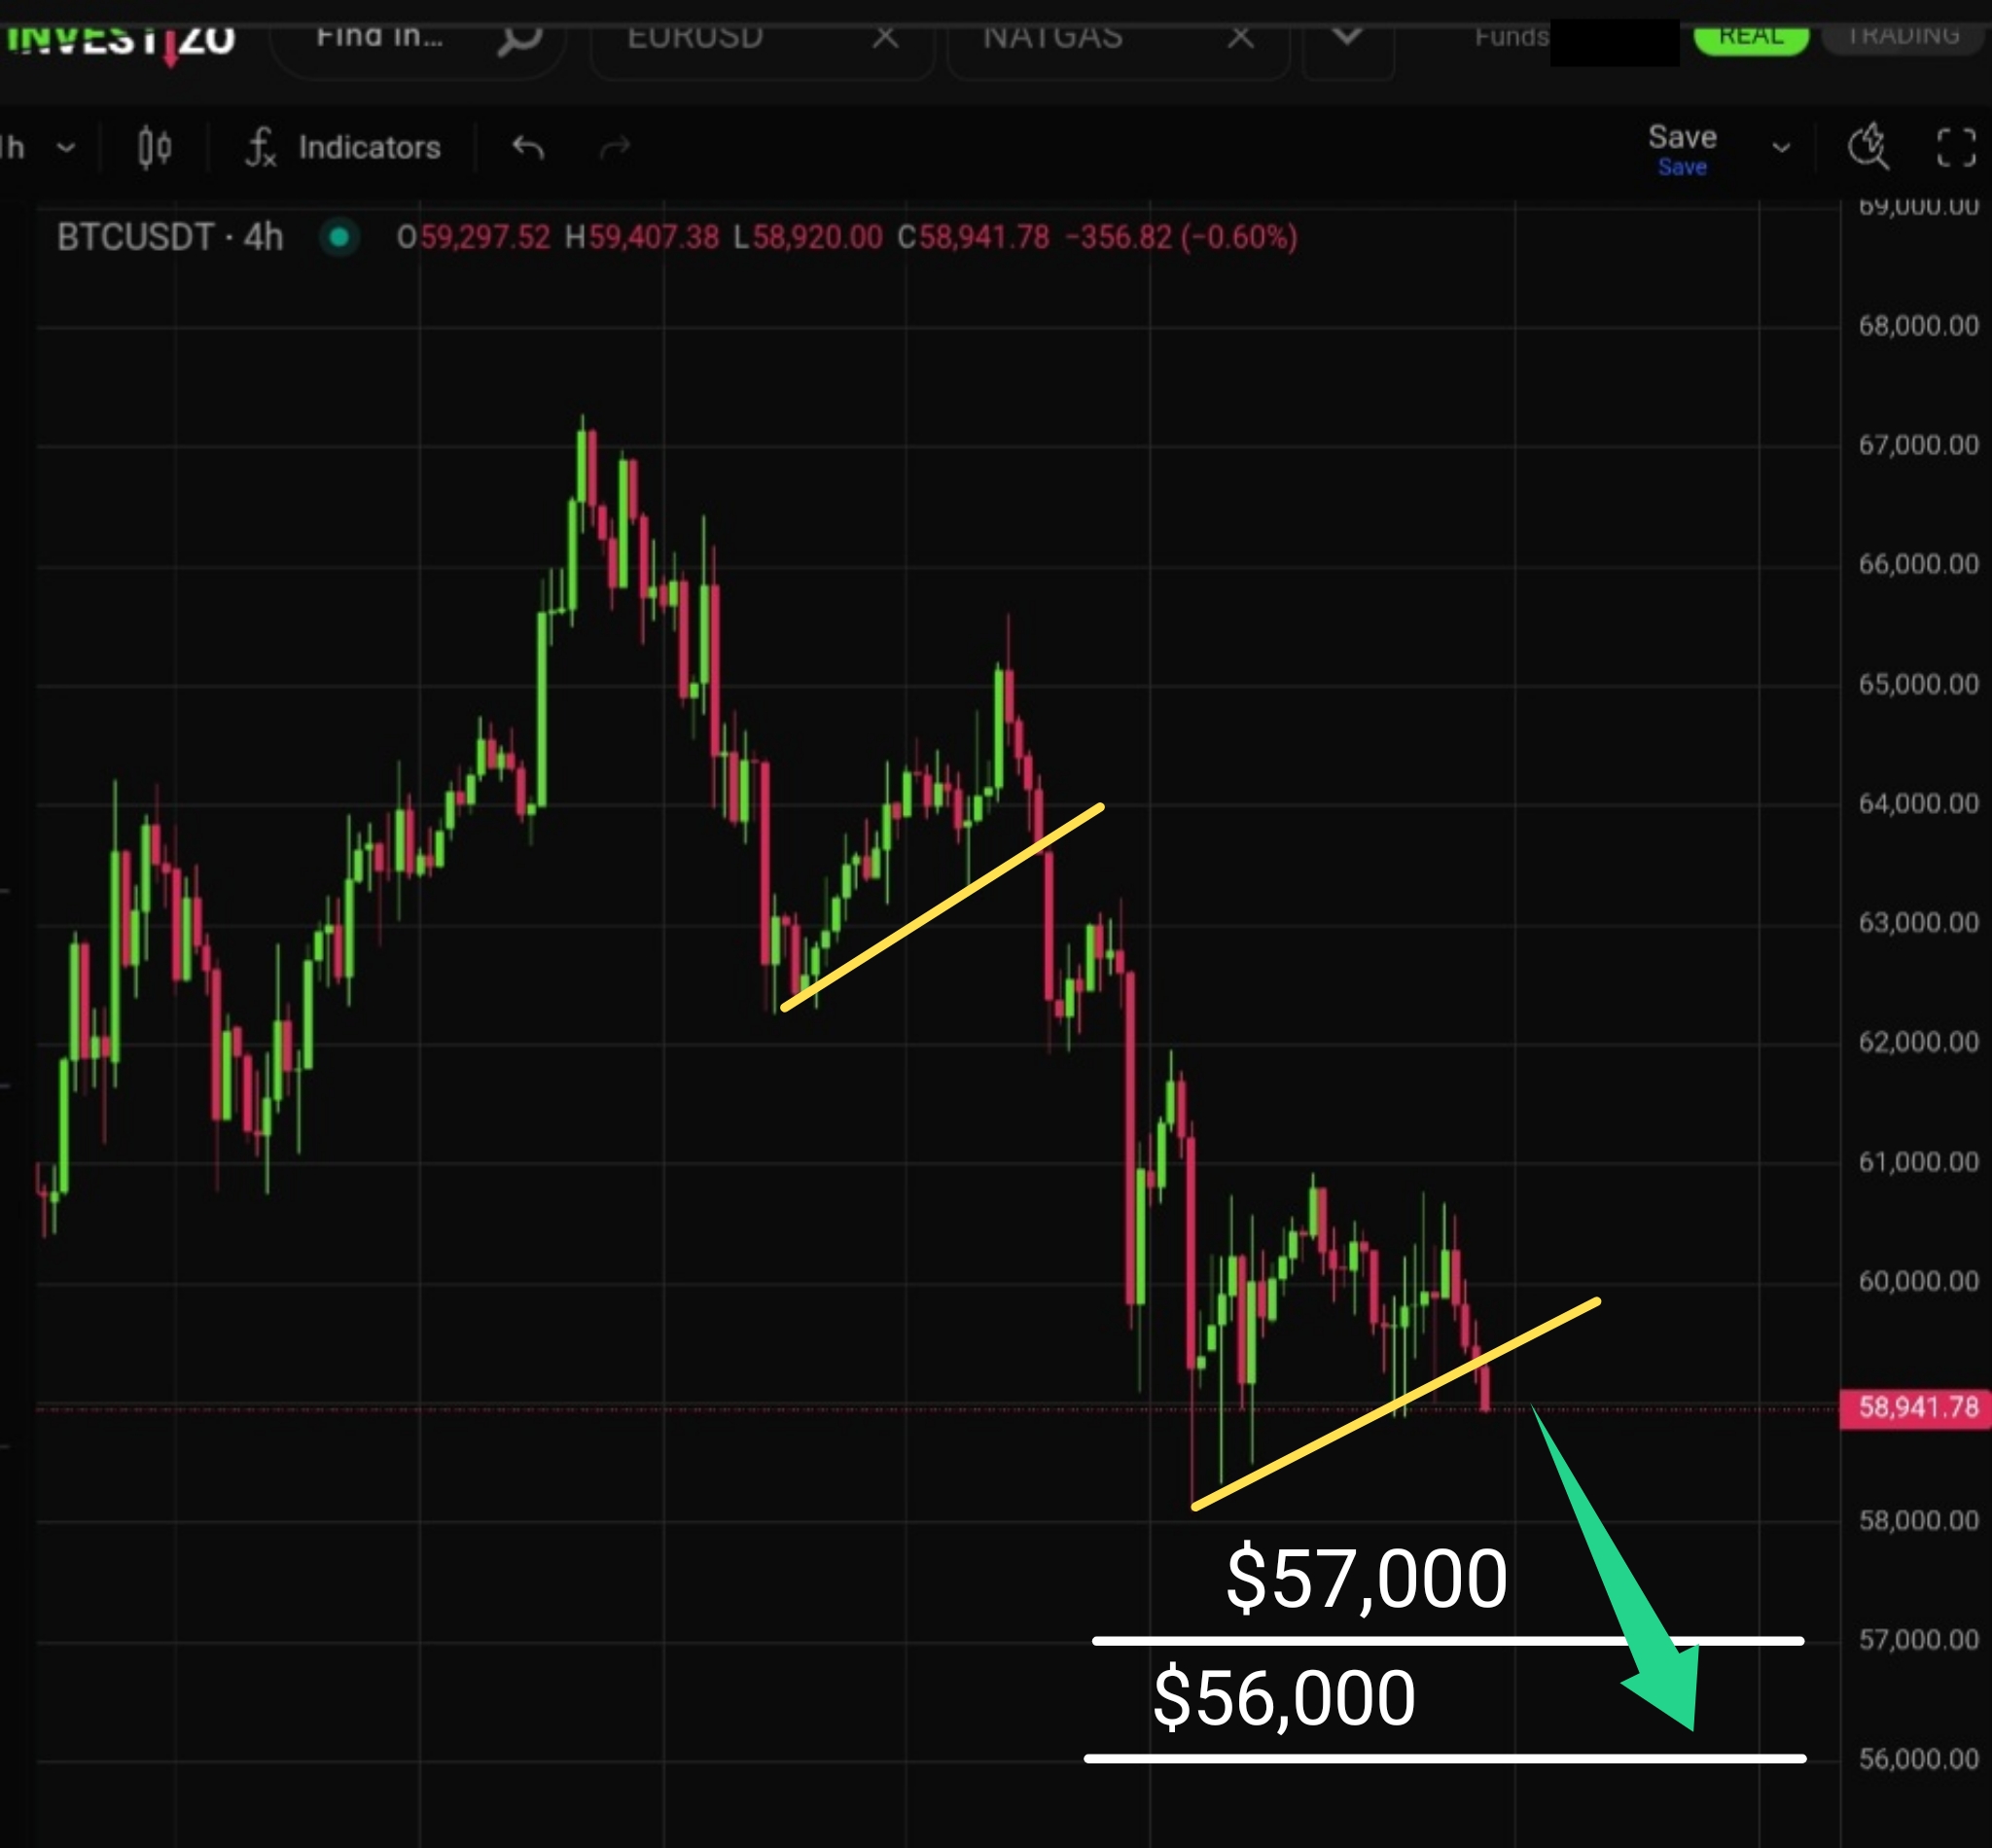
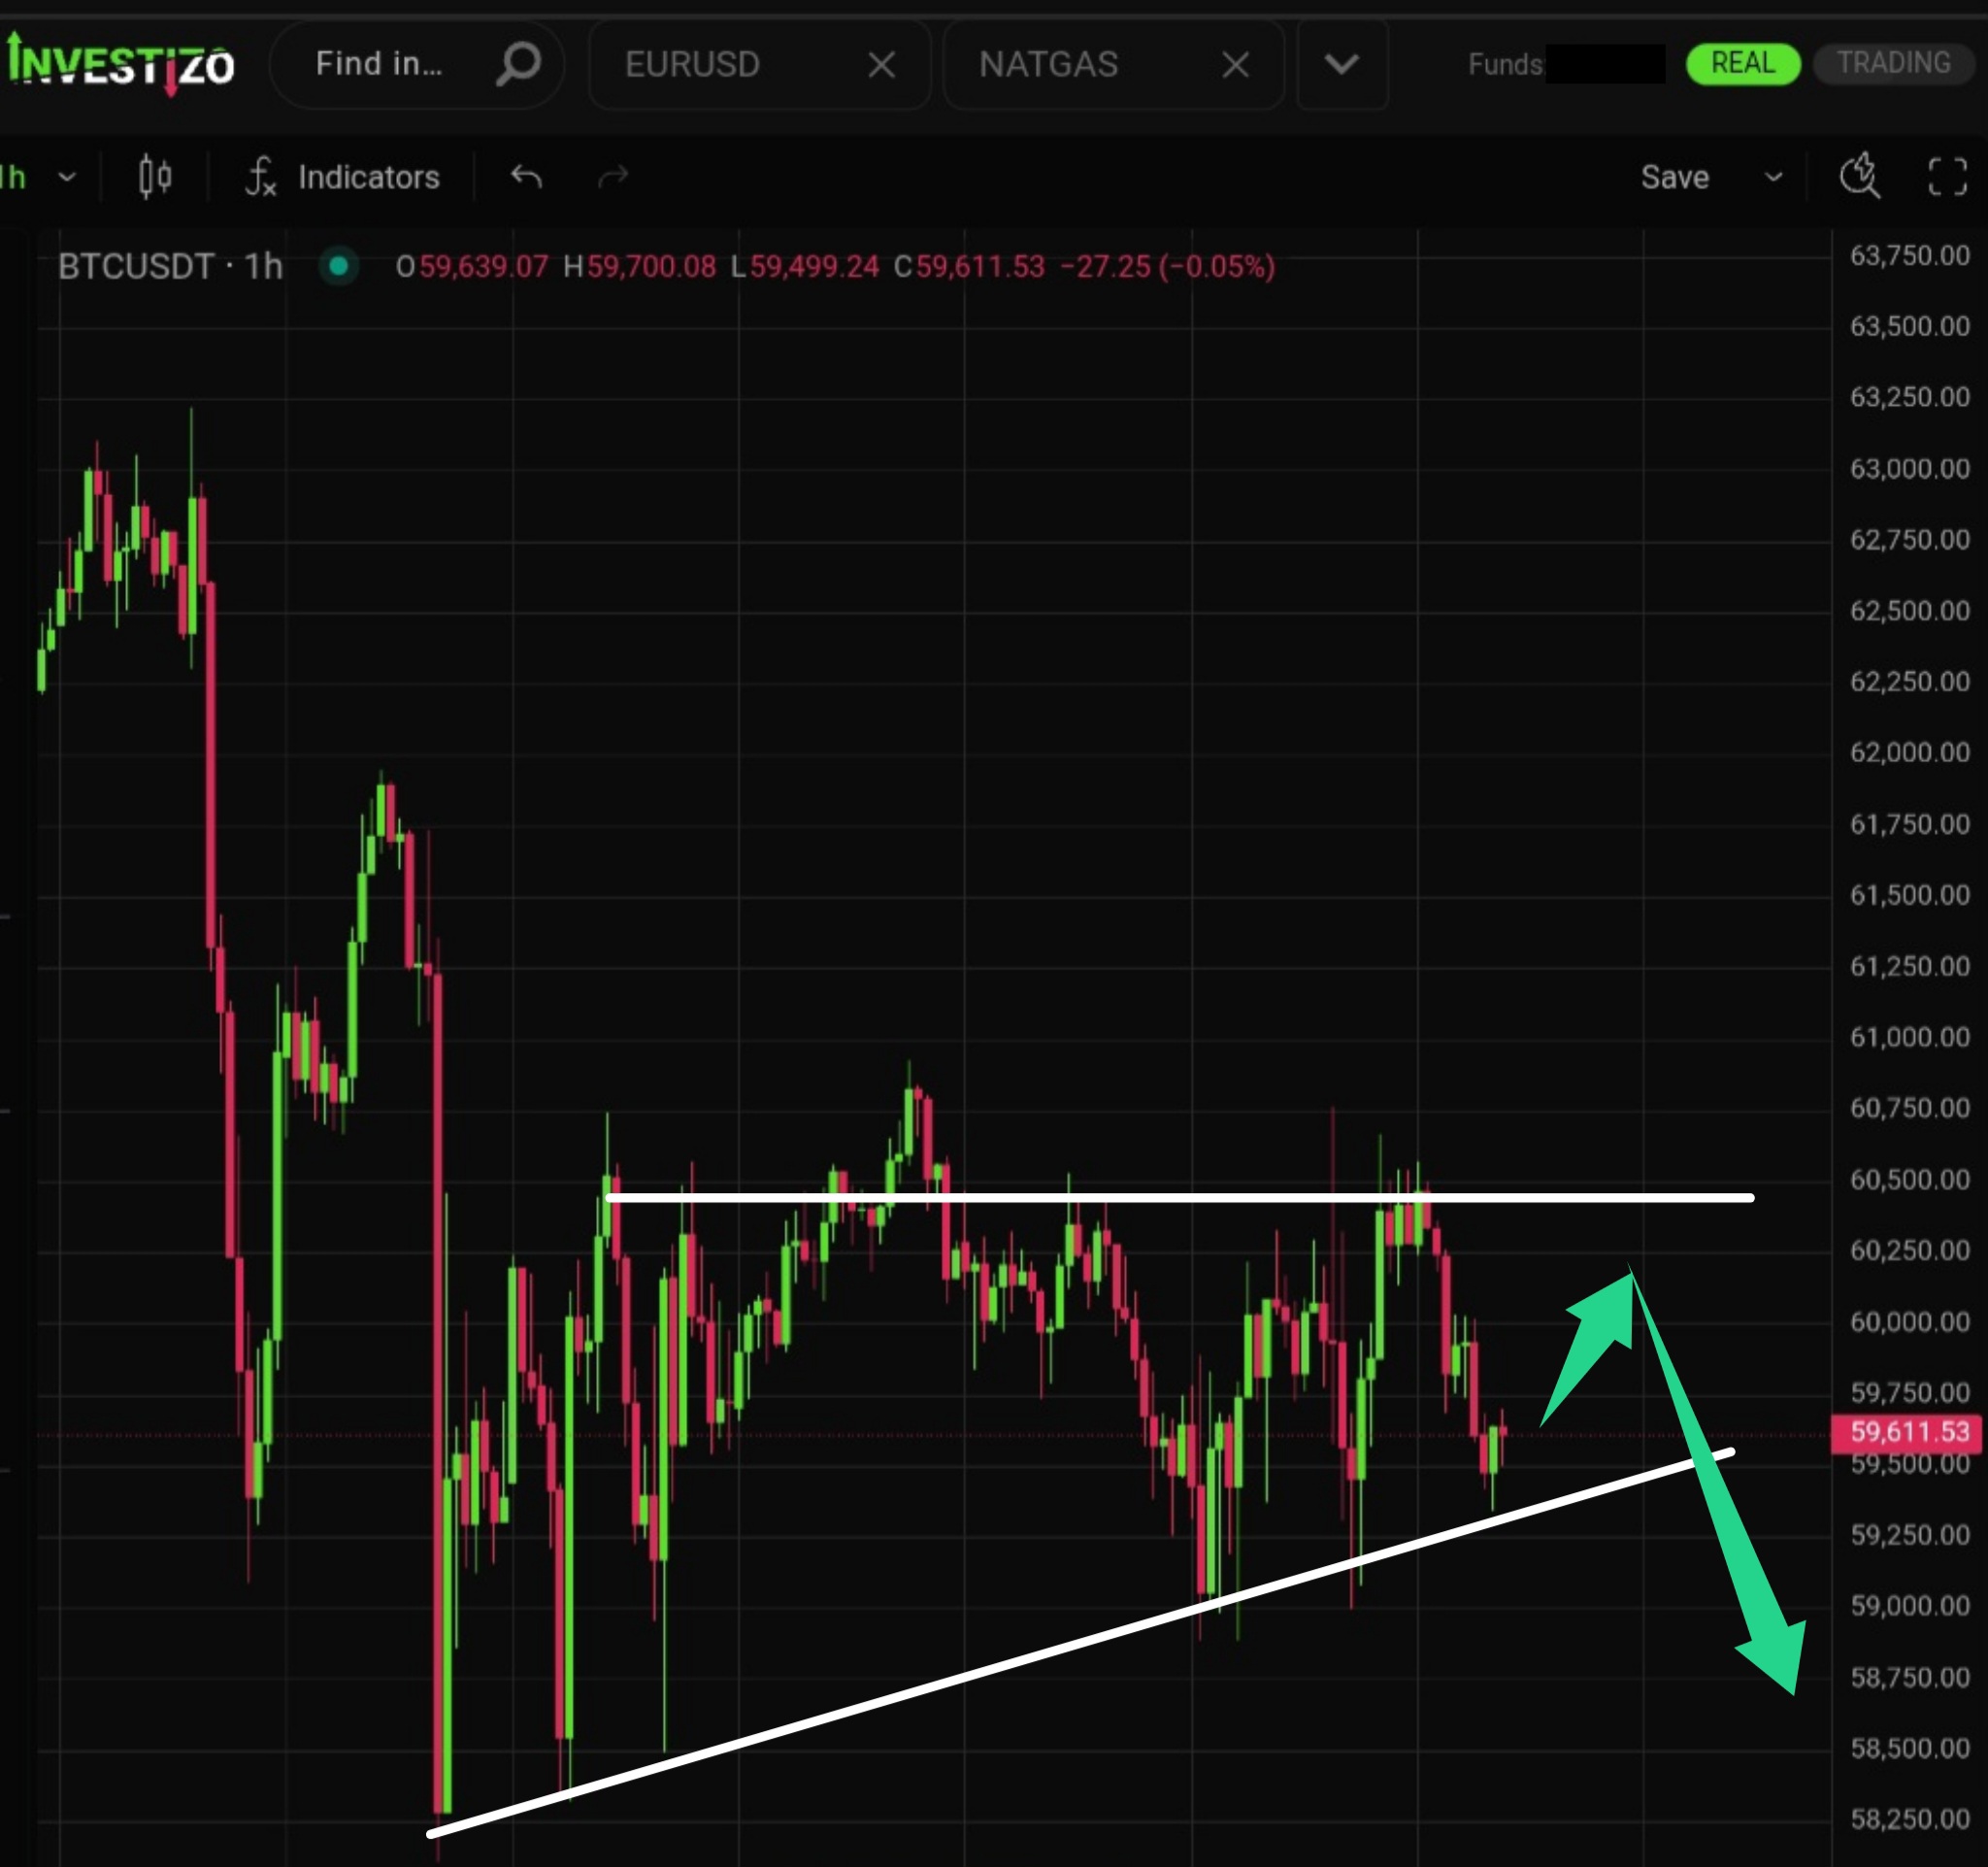
After several attempts by bulls to defend the price above $60,000, Bitcoin has slipped below $59,000 and is now preparing to break the sloping support line.
The bullish trend has ignored any potential signs of buyer exhaustion. As a result, the strong advance has continued with impressive momentum.
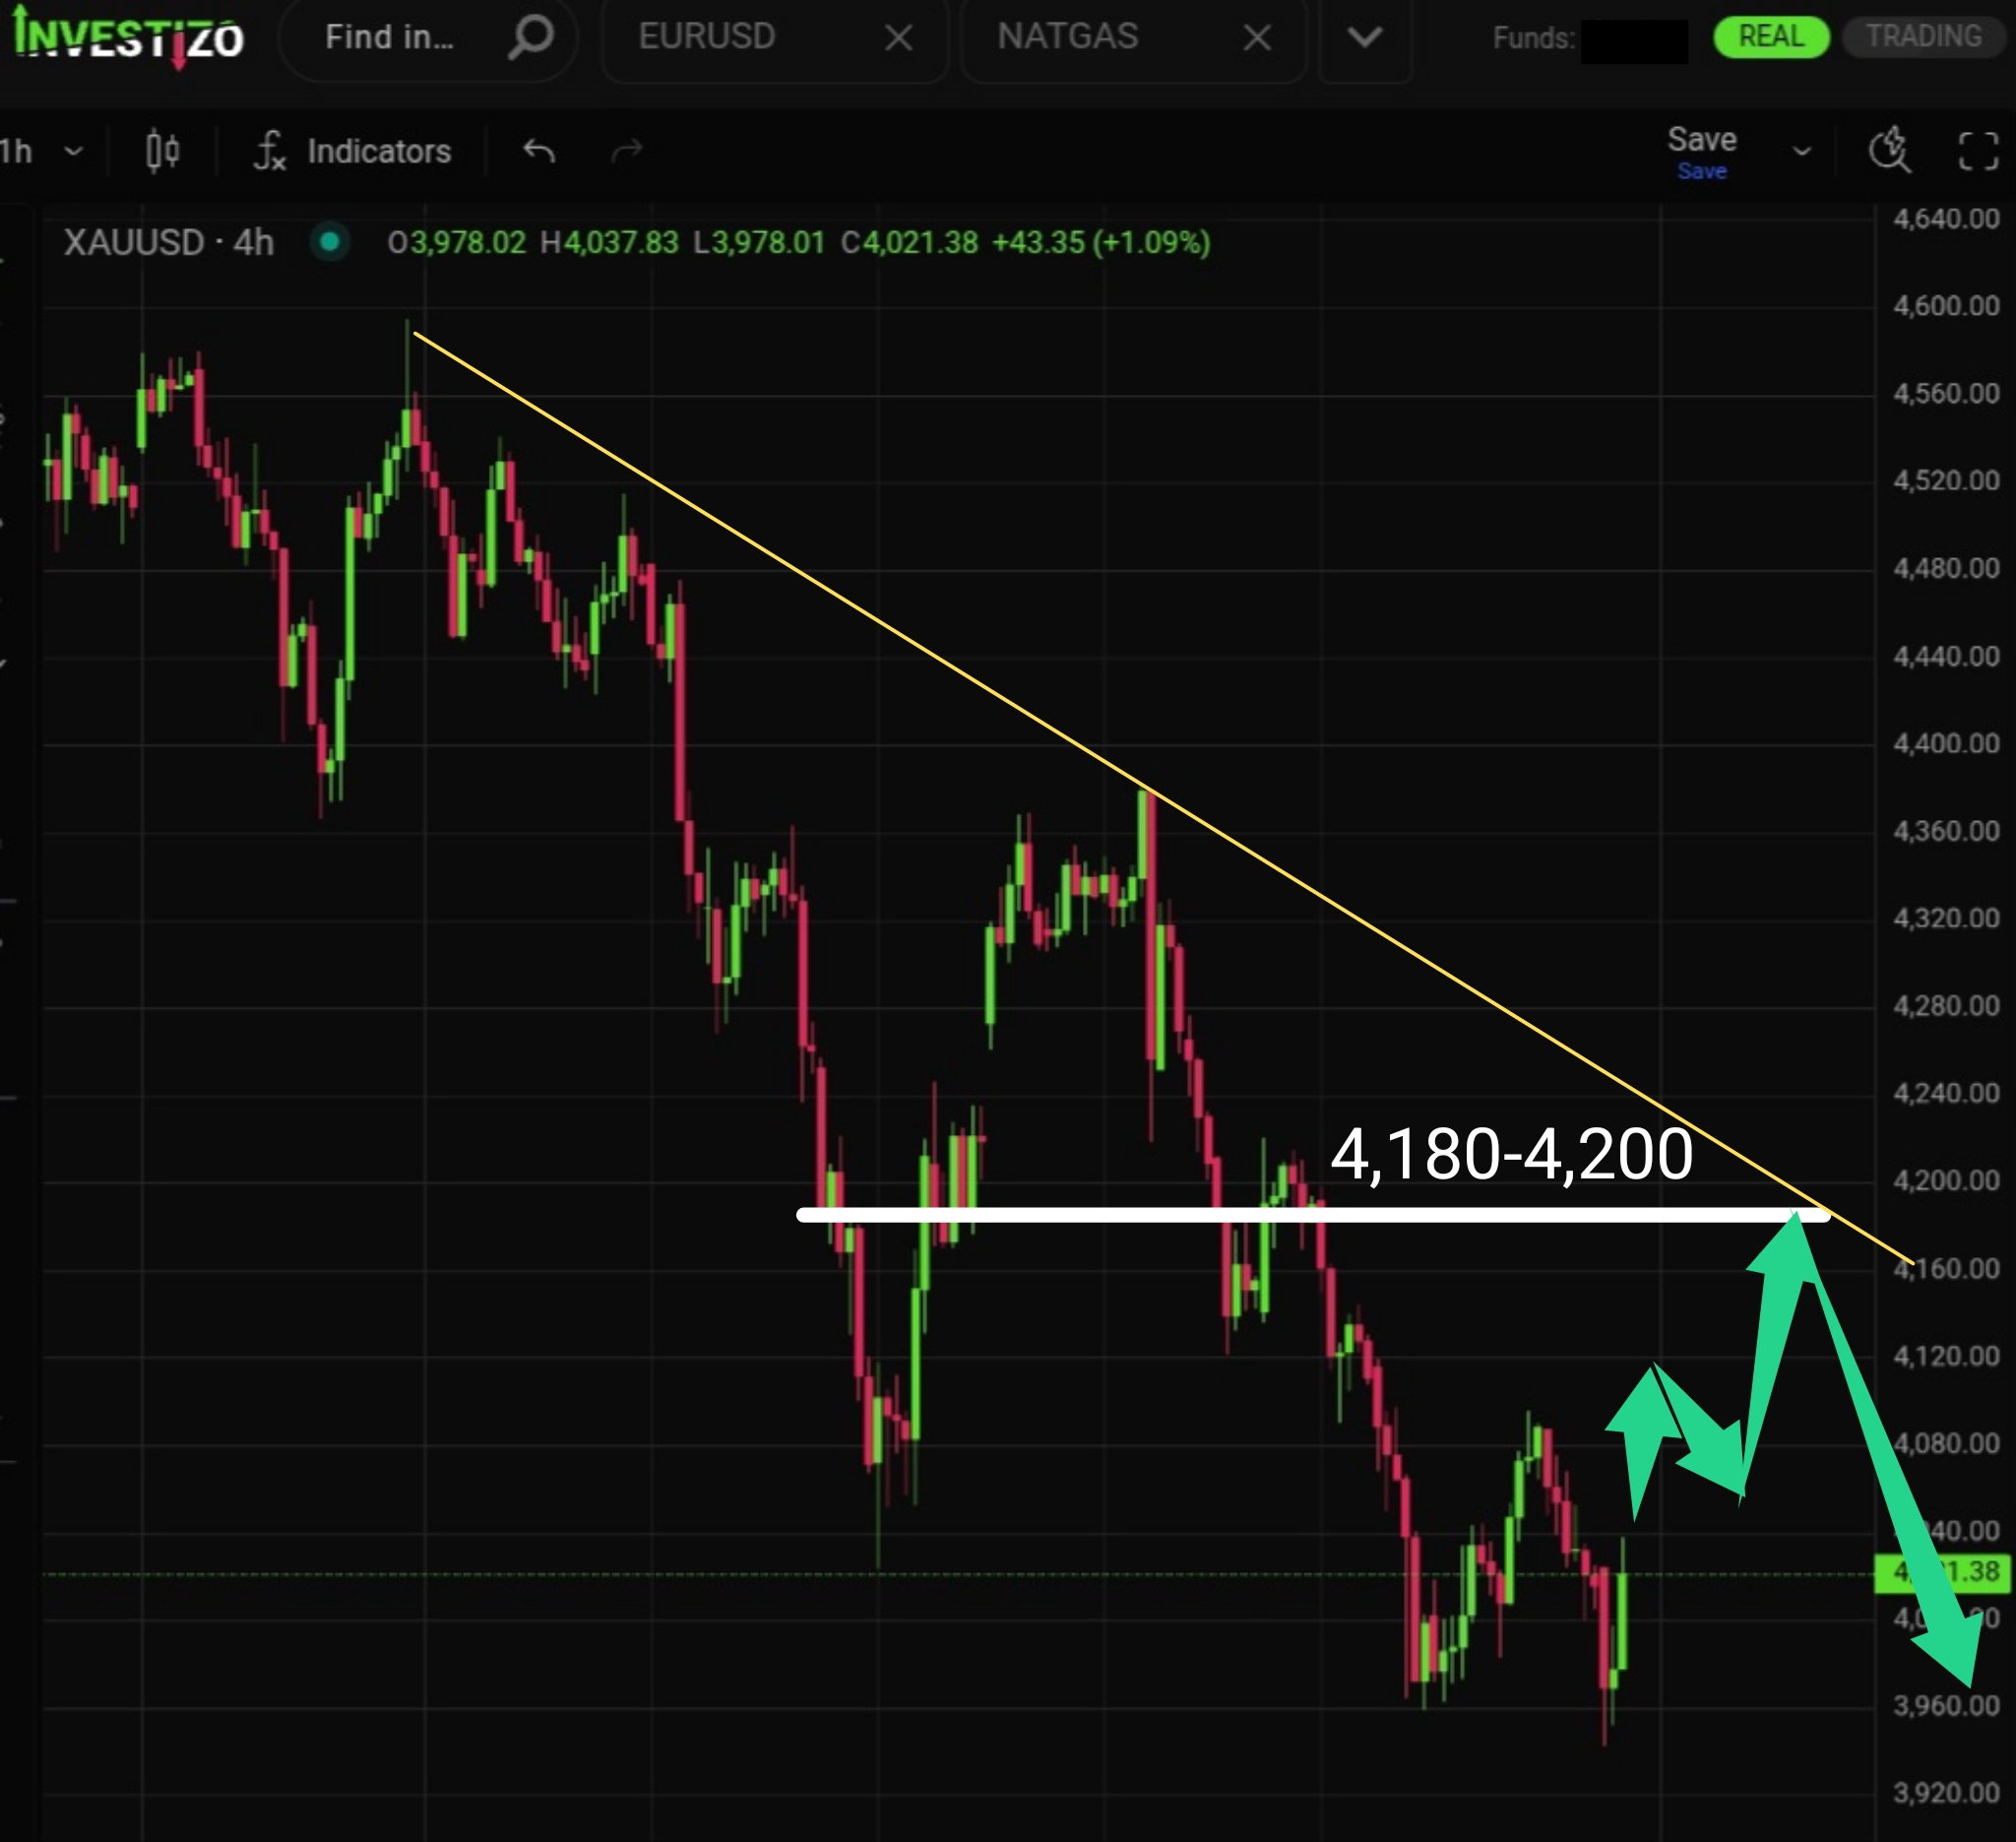
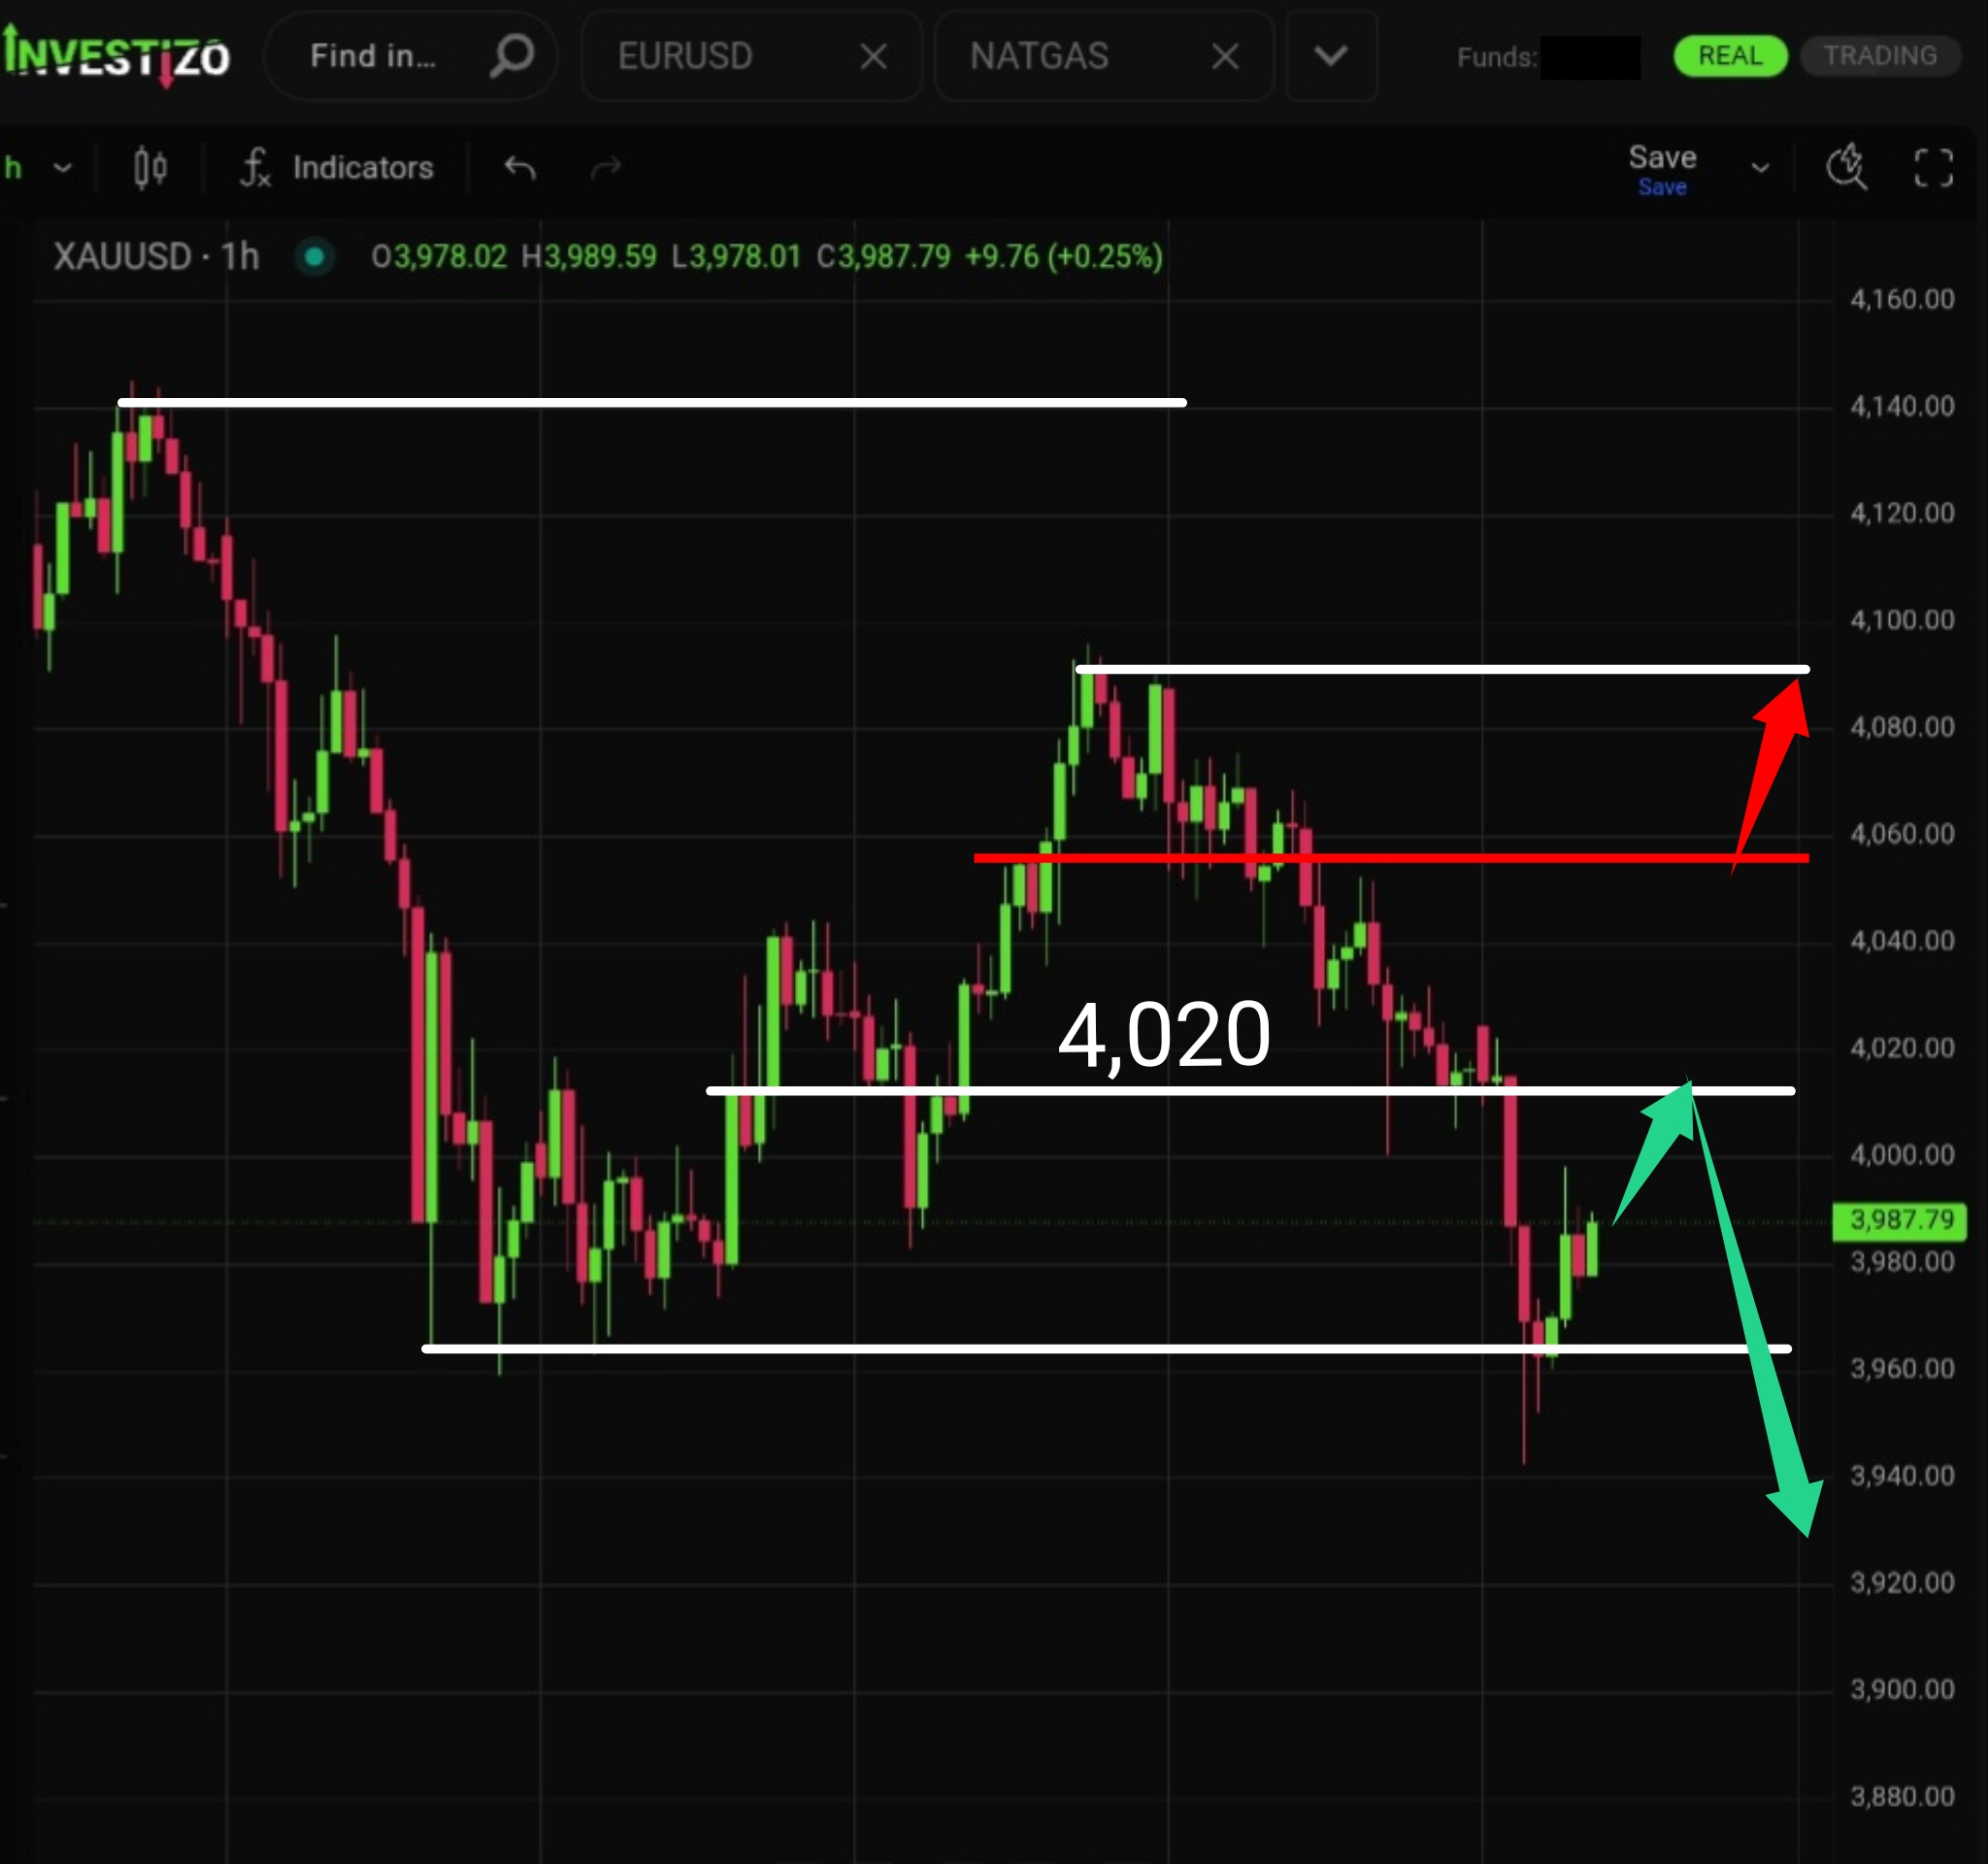
Following a fresh low, gold has shifted into a technical correction. No strong bullish triggers have formed, which means the rebound could stall or reverse at any moment.
Bulls have been building momentum for a breakout toward the 1.1500–1.1510 zone for some time, with only one remaining obstacle.
The Brent oil market has entered a flat consolidation phase, trading above the $72.00 level without clear bullish reversal signals.
Bitcoin is trading at $59,611, slipping back below the critical $60,000 psychological threshold.
Gold is trading just below the psychological $4,000 level, consolidating after setting a historic volatility record.
Ethereum, like Bitcoin, remains under strong selling pressure but is currently undergoing a local corrective rebound after bouncing from the key psychological support.
The downside reversal scenario has not yet been activated, although it remains relevant (at least until the most recent high is updated).