
Fundamental analysis of WTI
US benchmark WTI crude oil is currently under downward pressure and is trading around 75.50 USD.
The U.S. Energy Information Administration reported that for the week ending July 14, production was lower by 708 thousand barrels from the forecasted 2.44 million barrels. This led to a deflation in WTI crude oil prices. Unexpected demand had an impact on oil prices, boosting earnings. At the same time, external factors such as the global crisis and trade controls are also affecting black gold prices. The recent escalation in the trade dispute between the US and China amid US concerns over foreign investment and intellectual property restrictions could put additional pressure. China's response to any possible restrictions could affect the global oil market.
Conversely, expectations of a dovish Fed stance could limit WTI losses. As the Fed's policy tightening cycle seems to be coming to an end, market participants expect inflation to be deferred, leading to lower borrowing costs, which could stimulate and indirectly support the economy. Exports of one million tons of oil in the third quarter may put pressure on global oil dynamics. In addition, market participants are watching China's efforts to strengthen its economy, which could lead to an increase in oil consumption in the world's second largest economy.
Also important is Russia's projected 2% cut in production.
In the coming weeks, the market will focus on such macro indicators as the purchasing managers' index (PMI) in the U.S. manufacturing sector and PMI in the services sector. Demand and output in the Philadelphia business sector will continue to be closely monitored. All these factors may affect the WTI price.
To summarize, the short-term market behavior of WTI mainly depends on the interplay of these factors, including domestic storage, China-US relations, Fed policy and Russian production cuts.
Technical analysis and scenarios:
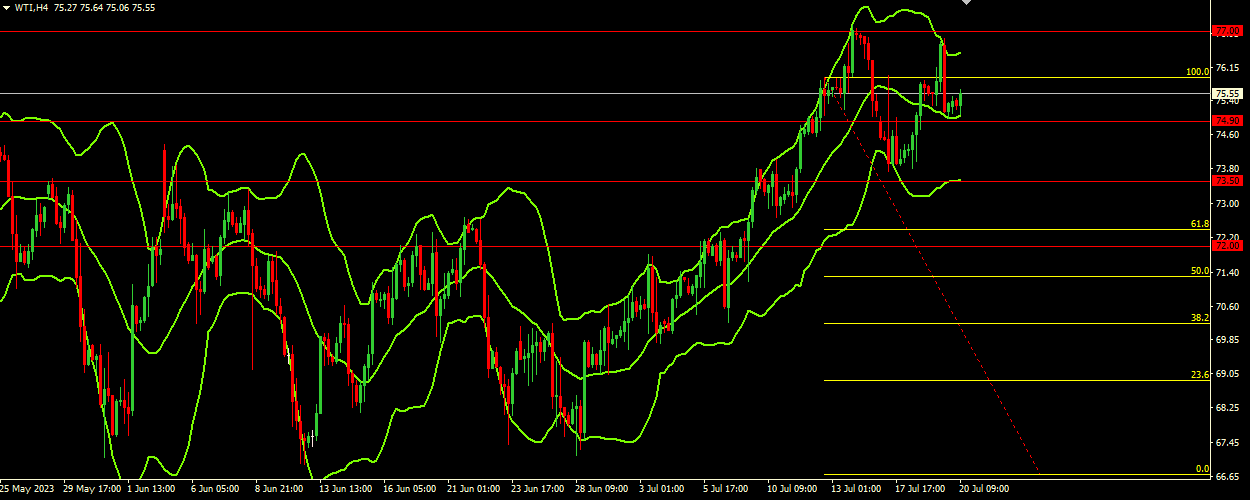
WTI crude oil is currently trading at 75.50 USD, in the upper range of the Bollinger Bands indicator, suggesting a sideways trend as the indicator is pointing horizontally, maintaining a wide price range. This indicates a fairly balanced market with bulls and bears fighting for control of the situation.
Main scenario (BUY)
Recommended entry level: 77.00.
Take Profit: 78.50.
Stop loss: 76.00.
Alternative scenario (SELL)
Recommended entry level: 74.90.
Take Profit: 73.50.
Stop loss: 76.00.