Technical analysis USA.30 for 04.12.2023
04.12.2023 17:04
Intraday
Technical
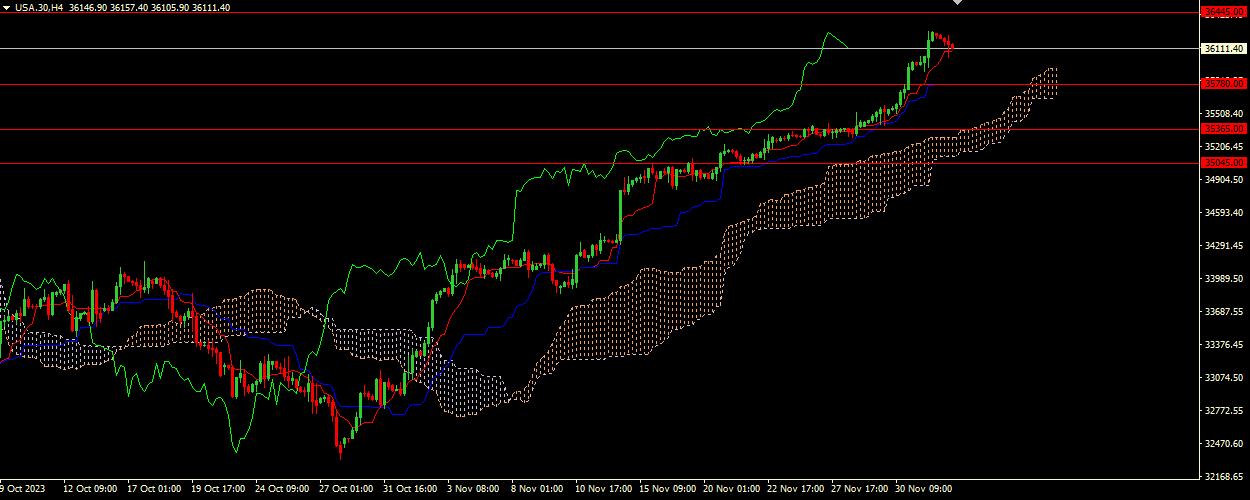
The Tenkan-sen line is located above the Kijun-sen line. Both lines are horizontal. Confirmatory line Chikou Span is above the price chart. In this case, the cloud is ascending. Instrument is trading above the Tenkan-se and Kijun-sen lines. The closest resistance is the level 36445.00. The closest support is the level 35780.00
Key levels
- 37400.00, 36900.00, 36445.00, 35780.00, 35365.00, 35045.00
Trading scenario
- Recommended opening long positions (Buy Stop) from the level of 36445.00, with Take Profit of 36900.00 and Stop Loss of 36100.00
Alternative scenario
- Recommended opening short positions (Sell Stop) from the level of 35780.00, with Take Profit of 35365.00 and Stop Loss of 36100.00
Scenario
Recommendation
BUY STOP
Entry Point
36445.00
Take Profit
36900.00
Stop Loss
36100.00
Key Levels
37400.00, 36900.00, 36445.00, 35780.00, 35365.00, 35045.00
Alternative scenario
Recommendation
SELL STOP
Entry Point
35780.00
Take Profit
35365.00
Stop Loss
36100.00