
Technical analysis XAUUSD for 06.10.2021
XAU/USD, H4
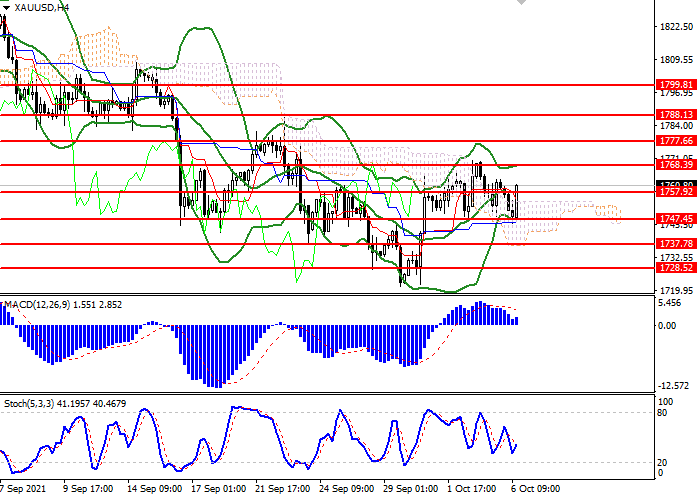
On the 4h chart the instrument is testing the moving average of the Bollinger bands, which is the nearest resistance level. The key resistance level is 1770.00, the breakdown of which will take the pair to the range of 1800.00-1820.00. Indicator is directed sideways and the price range has expanded insignificantly, which indicates the presence of correctional dynamic. The MACD histogram is consolidating in the neutral zone, confirming the upward correction. Stochastic Oscillator turned up at the border of the oversold area, a signal to enter the market is not formed.
XAU/USD, D1
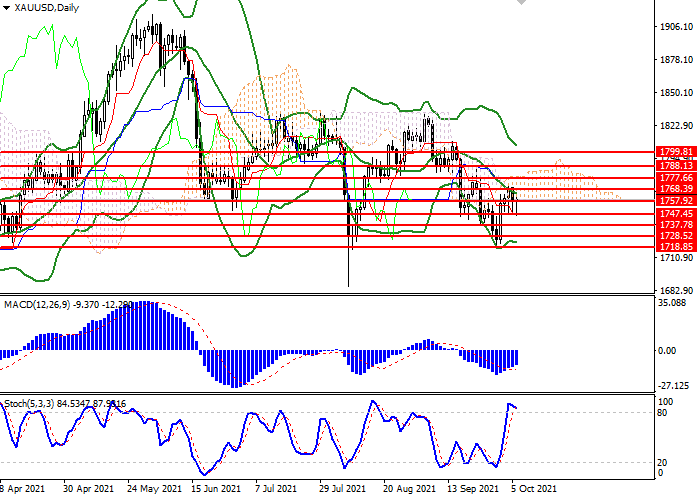
Key levels
Support levels: 1718.00, 1729.00, 1738.00, 1747.00.
Resistance levels: 1760.00, 1769.00, 1778.00, 1.1790.00, 1800.00.
Trading scenarios
Long positions should be opened above the level of 1764.00 with a target of 1785.00 and a stop loss at 1751.50.
The implementation period is 2-3 days.Short positions can be opened below the level of 1751.50 with a target of 1725.00 and stop loss at the level of 1759.00.
Implementation period of 2-3 days.