
General analysis Brent for 01.02.2022
Current Dynamics
Oil prices have declined modestly this week, but continue to hold near seven-year highs. In January, Brent posted its biggest monthly gain of the year.
There is a supply shortage on the hydrocarbons market, while production activity in some major economies continues to rise. Oil is supported by the difficult geopolitical situation in Eastern Europe and the Middle East. Possible supply disruption due to the escalation of the conflict may increase the deficit in the market.
At the same time, traders are waiting for the OPEC+ meeting, which will take place tomorrow. Participants of the agreement will probably continue to follow the plan to increase production in February. It is worth noting that the largest producers have been producing less crude than stipulated by the agreement for several months. In addition to production capacity constraints in some countries, equipment downtime due to planned maintenance work should also be taken into account.
Today at 23:30 (GMT+2) the API will release its weekly change of core oil products inventories in the United States.
Support and resistance levels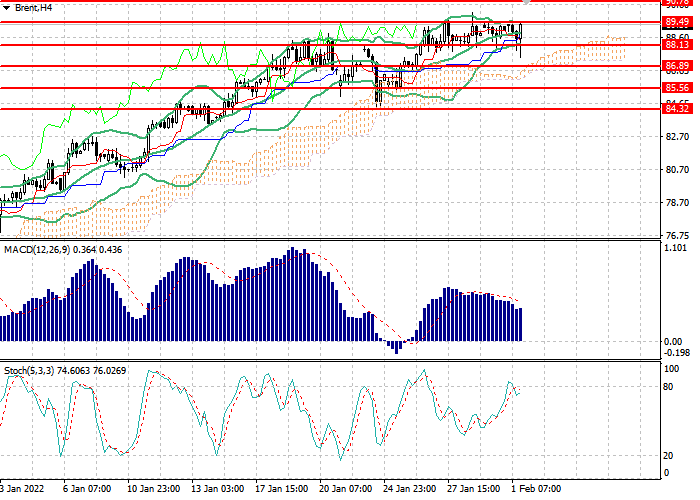
On the 4-hour chart, the instrument is testing the Bollinger Bands Moving Average, which is the nearest resistance level. The indicator is pointing sideways and the price range has contracted, indicating the presence of corrective dynamics. The MACD histogram is in the positive zone, preserving a buy signal. Stochastic has left the overbought area, but has slowed its fall and corrected upwards.
- Support levels: 84.30, 85.55, 86.90, 88.10.
- Resistance levels: 88.50, 90.75, 91.60.
Trading scenarios
- It is possible to open long positions at the current price with a target of 91.15 and a stop loss at 88.10. Implementation period: 1-2 days.
- Short positions should be opened below the level of 88.10 with a target of 86.70 and a stop-loss at the level of 89.60. Implementation period: 1-2 days.