Current dynamics
The XAU/USD strengthened moderately on Wednesday, rebounding from a 3-month low. The instrument is now trading within a downtrend correction. The reason for yesterday's recovery is the release of mixed data on the US Consumer Price Index. The report confirmed that inflation is high enough for the Fed to remain on course for a rate hike. However, the small increase calls into question the expected scope for a monetary policy tightening.The consumer price index rose by only 0.3% in April and although the figure was 0.1% higher than forecasted, this development is a signal that inflation has reached its peak. Of course, the increase of only 0.3% is due to the fact that gasoline prices in the USA fell by 6.1% in April, after rising by 18.3% in March. Such a small increase contrasts sharply with the 1.2% rise in March. Over the 12-month period, the consumer price index rose 8.3%. Excluding volatile components such as food and energy, the index rose 0.6% after 0.3% in March. The core index rose 6.2% after March's jump of 6.5%, the biggest gain since 1982.
Also worth noting is the strengthening of gold amid falling US Treasury bond yields. At the start of Wednesday the yield on ten-year bonds was just under 3% and then on publication of the CPI the yield was above 3% but then fell to 2.93%. The yield development indicates that the report was weaker than bond sellers had anticipated.
Therefore the chance of a 75 basis points rate hike in the next two meetings is considerably reduced, however, even if inflation has peaked, it will remain high enough for an aggressive monetary policy of the Fed for a long time. At the moment, gold could stabilise, but the recovery will be limited. However, it should be taken into account that the situation might change sharply given that the May CPI data will be published before the regulator's meeting in June.
Support and resistance levels
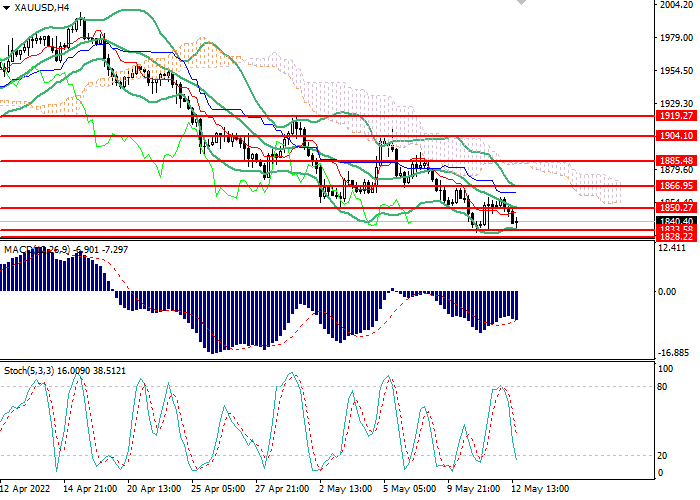
On the 4-hour chart the instrument is consolidating near the lower bollinger band. The indicator is pointing downwards and the price range is widening, indicating a continuation of the downtrend. The MACD histogram is in the negative zone, maintaining a sell signal. Stochastic has entered oversold area, a buy signal may be formed within 1-2 days.- Support levels: 1833.50, 1828.25, 1814.10, 1800.30.
- Resistance levels: 1850.30, 1867.00, 1885.50, 1904.10, 1919.30.
Trading scenarios
- Short positions should be opened below the level of 1833.50 with a target of 1814.50 and a stop loss at 1851.00. Implementation period: 2-4 days.
- Long positions can be opened above the level of 1854.90 with a target of 1882.30 and a stop loss at the level of 1842.80. Implementation period: 1-2 days.