
General analysis USDCHF for 14.06.2022
14.06.2022 15:39
MInggu
Umum
Current dynamics
The USD/CHF pair witnessed a decline at the beginning of today's trading session, after it was close to parity with the Swiss Franc for the first time since mid-May.
The increasing expectations regarding the Federal Reserve’s direction to raise the interest rate by 75 basis points during its meeting this week, instead of 50 basis points, may be one of the most important reasons for the dollar’s performance in the recent period.The reading of US macroeconomic data last Friday led to an increase in these expectations, after it showed an acceleration of annual inflation in the United States to its highest level in more than forty years. The data showed US consumer price growth accelerating in May to 1.0% as gasoline prices hit a record and the cost of services rose further, while core prices rose 0.6%.
On the other hand, the statements of the US Federal Reserve members continued during the last period, and the statements of many of them were similar regarding the importance of accelerating the rate of raising interest rates during the June meeting at a very large pace to curb high inflation.
Where the US Federal Reserve Governor, Jerome Powell confirmed that the central bank is committed to reducing the rate of inflation in the American market, and there will be no hesitation in taking decisions to raise the interest rate to control prices. At the same time, US Federal Reserve member Bullard stressed that the current economic conditions raise concerns and doubts about the credibility of the US Federal Reserve on inflation, and that the US Federal Reserve must take important steps to return inflation to 2%, including raising interest rates.
Looking ahead and in the absence of Swiss macroeconomic data, the markets will be looking forward to the release of the PPI reading, which is a preliminary indicator of inflation. In addition to the most important event, the Federal Open Market Committee meeting today and tomorrow, Wednesday, in Washington, to discuss interest rates.
Support and resistance levels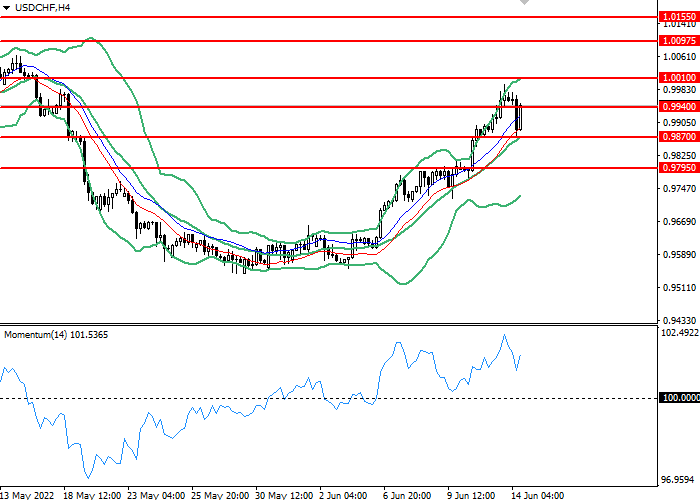
On the 4 hour chart, the instrument is moving above the Bollinger Bands moving average. The indicator is oriented sideways and the price range has shrunk, indicating that the current trend is about to change. The momentum chart is above the 100 level, which gives sell signals. The Envelopes indicator give buy signals.
- Support levels: 0,99400, 0,98700, 0,97950.
- Resistance levels: 1,00100, 1,00975, 1,01550.
Trading scenarios
- Long positions should be opened at the 0,99400 with a target of 1,00100 and a stop loss at 0,98700. Implementation period: 1-2 days.
- Short positions can be opened at the level of 0,98700 with a target of 0,97950 and a stop-loss at the level of 0,99400. Implementation period: 1-2 days.