
Fundamental analysis of USD/JPY
USD/JPY is showing resilience, having managed to recoup some of the losses incurred after the long-awaited FOMC decision, trading at 140.200.
The US Federal Reserve decided to raise interest rates by 25 basis points, which coincided with general expectations. The central bank cited persistently high inflation as the reason for the move. Fed Chairman Jerome Powell's press conference following the meeting reinforced the likelihood of another rate hike in September, emphasizing the need for the slowing economy and weak stock market to work to bring inflation back to the 2% target. This stance is supportive for the US Dollar (USD) and acts as a headwind for the USD/JPY pair.
On the other hand, the Japanese Yen (JPY) is experiencing a headwind. The Bank of Japan will maintain a loose monetary policy. BOJ Governor Kazuo Ueda has reiterated the central bank's commitment to this stance, and the stability of the long-term yield curve control has added pressure. In addition, the safe haven status for the yen was weakened by the prevailing optimism in global equity markets, further contributing to the moderately positive trend in the USD/JPY pair.
However, despite the intraday uptrend, bullish confidence is still lacking, suggesting caution for further rate hikes on the day. The next session in the US will be crucial for the direction of the pair as GDP data will take center stage. Fed Chairman Powell and the market are hoping for a soft landing and weaker than expected GDP numbers, which could raise concerns of a possible recession after the recent rate hike.
Amidst market turmoil and uncertainty, the USD/JPY pair seems to be navigating difficult waters, prompting traders to keep a close eye on upcoming economic indicators and key events. Traders are currently awaiting the release of US second quarter GDP data early in the North American session, as well as unemployment, durable goods orders and real estate sales. This data could provide additional momentum to the pair.
Technical analysis and scenarios:
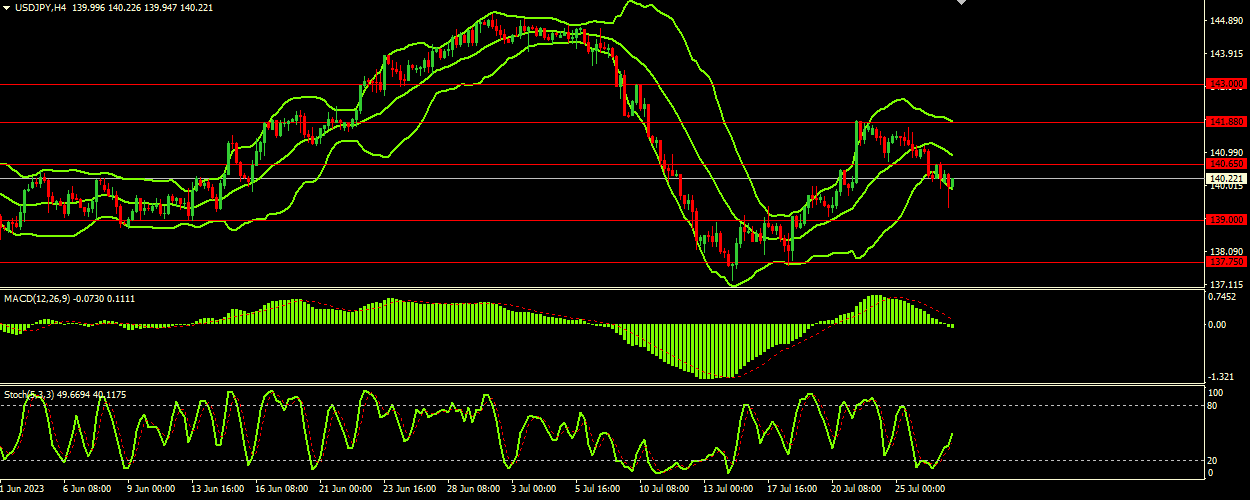
The stochastic oscillator shows a value of 46.8659, with a signal at 39.1830. The indicator indicates that the pair is not in oversold or overbought territory but has a slight bearish bias. Bollinger Bands: The Bollinger Bands have an upper band at 141.880, a middle band at 140.910 and a lower band at 139.880. The indicator is pointing downward, indicating a bearish trend. The wide price range indicates increased volatility and the current price is near the lower band of the indicator. The MACD value is -0.0815 and the signal is at 0.1102. The MACD line is below the signal line, signaling bearish momentum. Judging from the presented indicators and key levels, the USD/JPY pair seems to be under bearish pressure. The price is below the middle Bollinger Band and the MACD is in negative territory. The Stochastic oscillator is also indicating a bearish trend. Resistance levels are potential barriers for any upward movement, while support levels can act as targets for bearish movements.
Main Scenario (SELL)
Recommended entry level: 139.000.
Take Profit: 137.750.
Stop Loss: 139.500.
Alternative scenario (BUY)
Recommended entry level: 140.650.
Take Profit: 141.880.
Stop loss: 141.000.