
Technical analysis SPX500 for 28.08.2023
28.08.2023 01:15
Harian
Teknikal
The Tenkan-sen line crosses from top to bottom the Kijun-sen line. Red is directed downward, while blue remains horizontal. Confirmatory line Chikou Span is above the price chart. In this case, the cloud turned over from ascending to descending. Instrument adjusted to the Kijun-sen line. The closest resistance is the level 4431.00. The closest support is the level 4393.00
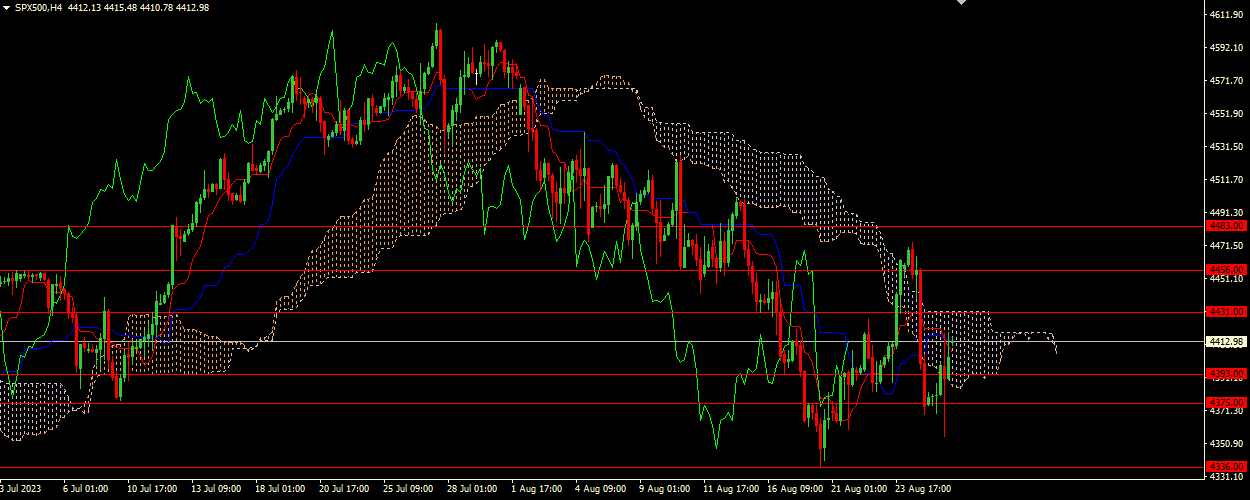
Key levels
- 4483.00, 4456.00, 4431.00, 4393.00, 4375.00, 4336.00
Trading scenario
- Recommended opening long positions (Buy Stop) from the level of 4431.00, with Take Profit of 4456.00 and Stop Loss of 4410.00
Alternative scenario
- Recommended opening short positions (Sell Stop) from the level of 4393.00, with Take Profit of 4375.00 and Stop Loss of 4410.00
Senario
Syor
BUY STOP
Titik Entri
4431.00
Take Profit
4456.00
Stop Loss
4410.00
Level utama
4483.00, 4456.00, 4431.00, 4393.00, 4375.00, 4336.00
Senario pilihan
Syor
SELL STOP
Titik Entri
4393.00
Take Profit
4375.00
Stop Loss
4410.00