Fundamental analysis of XAU/USD
Gold prices (XAU/USD) are showing notable resilience near one-month highs, largely due to recent weak economic data from the US. Market participants are relying on data, including a slowdown in second-quarter GDP growth and a jobs deficit forecast for August, to speculate that the Federal Reserve will keep interest rates at current levels. That explanation becomes even more plausible when other factors, such as lower Treasury yields and a smaller-than-expected drop in consumer confidence, are taken into account. Meanwhile, government bond yields appear to be slowly rising and are expected to rise for the fourth consecutive month. The market will focus on gathering full information on inflation trends, especially the upcoming personal consumption expenditure data and monthly employment data, which could be key clues.
Historical trends show that the combination of a recession and lower interest rates, or simply anticipating such a development, can increase the attractiveness of gold. An increase in shares of the SPDR Gold Trust, one of the world's leading gold-backed ETFs, indicates growing investor interest. On the other hand, a downturn in Chinese manufacturing could lead to global economic problems, which would further emphasize the importance of gold as a safe-haven instrument.
In the near term, the XAU/USD market is likely to be influenced by several key data points. These include the Eurozone CPI and HICP figures for August and, more importantly, the US PCE core price index for the same month. If the US inflation figure shows a weakening, gold lovers are likely to turn to the non-farm payrolls data to confirm a potential end to the Fed's hawkish path, which could further strengthen the XAU/USD price.
Thus, the recent flurry of economic data, the possibility of Fed interest rate reassessment and upcoming key data points to a bullish outlook for gold in the short to medium term.
Technical Analysis and Scenarios:
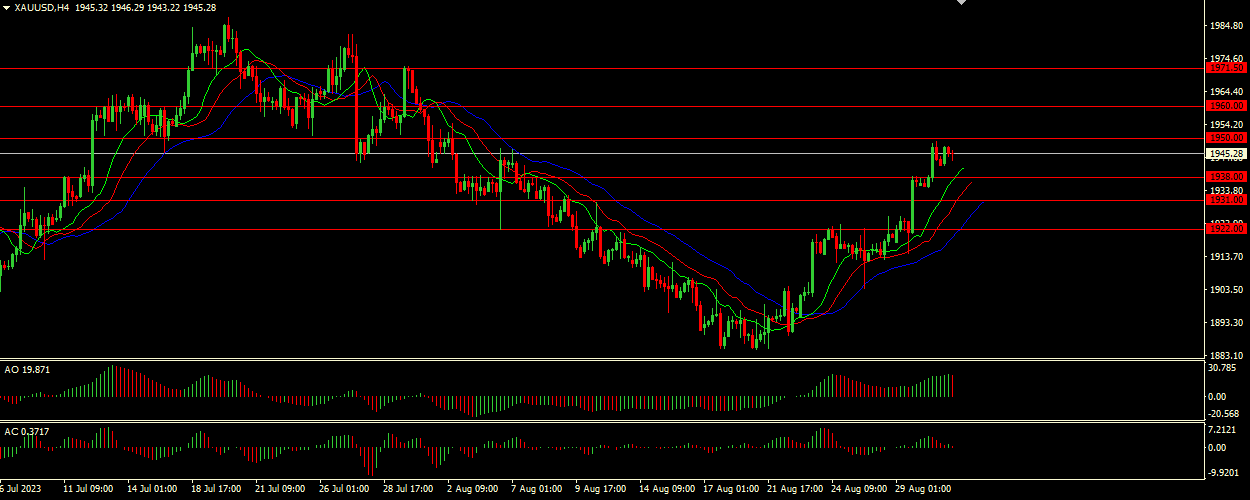
The jaws of the indicator are wide open, with the jaw (blue line) well below the lips and teeth (green and red lines). Overall, this suggests that the instrument is in an uptrend with strong bullish momentum. Both oscillators are in the red zone, which means a bearish signal. This may indicate a divergence from the upward momentum, which is indicated by the Alligator indicator, or a possible upcoming correction. Given the bullish signal of the Alligator indicator combined with the bearish signals of AO and AC, XAU/USD may be in a critical transition zone. A tug-of-war between bulls and bears may begin in the coming days. As always, one should keep a close eye on the price movement and consider setting tight stop losses for effective risk management.
Main scenario (BUY)
Recommended entry level: 1950.00.
Take Profit: 1960.00.
Stop Loss: 1945.00.
Alternative scenario (SELL)
Recommended entry level: 1938.00.
Take Profit: 1931.00.
Stop loss: 1945.00.