Fundamental analysis of WTI
WTI crude oil is navigating a complex market landscape reflecting a combination of geopolitical, economic and industry factors. As of Thursday, WTI is trying to regain ground, trading around 69.80 USD, after falling to its lowest level since July. This volatility is partly due to concerns over the decline in Chinese oil demand and the effectiveness of OPEC+ voluntary production cuts.
The latest data showed a sharp decline in US crude oil inventories, the first since July, down 4.6 million barrels in the week ending December 1. This contrasts with a significant 5.4 million barrel increase in gasoline inventories, hinting at higher refinery output. At the same time, China's oil imports fell to a four-month low, down 10.4% from October, adding to concerns about the state of the country's economy.
OPEC+ is dealing with its own problems, notably by announcing a 2.2 million barrels per day production cut, which nonetheless sent oil prices down about 10%. The group's production also fell in November due to reduced supplies from Nigeria and Iraq and ongoing cuts in Saudi Arabia. High-level talks between Russia and Saudi Arabia underscore efforts to stabilize the market.
Market structure points to a bearish near-term outlook for WTI. The combination of rising US gasoline inventories and lower import demand from China is contributing to a cautious sentiment, which could lead to further price fluctuations.
Investors are also keeping a close eye on global economic indicators, including weekly US jobless claims and non-farm payrolls data, which could have an impact on USD-denominated WTI prices. These developments, combined with doubts about OPEC+'s ability to stick to production cuts, contribute to a challenging and uncertain outlook for WTI.
Technical analysis and scenarios:
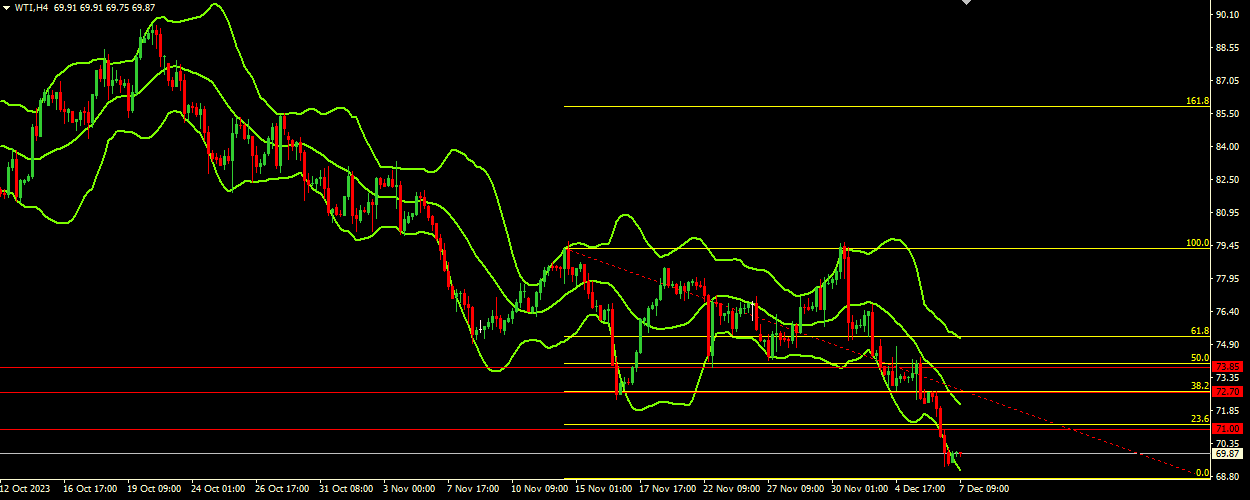
The current WTI price is at 69.80. Key support levels are at 68.50, 67.50 and 66.50, while resistance levels are at 73.85, 72.70 and 71.00. These levels will act as critical thresholds for bullish or bearish trends. The Bollinger Bands show a wide price range, indicating high volatility. The upper band is at 75.10, the middle band is at 72.10, and the lower band is at 69.00. The price is currently near the lower band, indicating bearish sentiment in the short term. The downward direction of the indicator also supports this bearish outlook.
Main scenario (SELL)
Recommended entry level : 68.50
Take Profit: 67.50
Stop Loss: 69.00
Alternative scenario (BUY)
Recommended entry level: 71.00
Take Profit: 72.70
Stop loss: 69.80