
Fundamental analysis of WTI for 05.02.2024
WTI oil price is fluctuating under the influence of a complex interaction between geopolitical tensions, economic indicators and market conditions.
At the beginning of Asian trading, WTI managed to avoid losses and traded at 72.50. Instability in the Middle East escalated due to US and UK airstrikes in response to a drone strike that killed three US soldiers in Jordan against Iranian-backed Houthi rebels in Yemen. The escalation was accompanied by threats from Houthi rebels to intensify military action and strong warnings from the U.S. of an immediate response, including action on Iranian territory.
These geopolitical developments came amid a strong U.S. labor market report that dampened expectations that the Federal Reserve would soon cut interest rates. Higher interest rates will curb economic growth and demand for oil, putting pressure on oil prices. In addition, a stronger dollar will make oil more expensive for non-dollar holders and reduce demand, leading to stronger sentiment as the discount rate fades. On the supply side, the Organization of the Petroleum Exporting Countries and its allies (OPEC+) have a long-term challenge to balance markets through oil prices. There is a fear that non-OPEC producers, especially the United States, will exceed production levels, causing global markets to suffer from oversupply.
Driven by the strengthening US dollar and expectations of market momentum, market sentiment remains gloomy. However, the situation in the Middle East, especially US involvement, and general conflicts, including tensions between Israel and Hamas, are factors that could disrupt supply and change market opinion. If an escalation of conflict disrupts supply, it could take the market out of weakness and demonstrate a tenuous balance between geopolitical risks and economic factors driving the oil market outlook.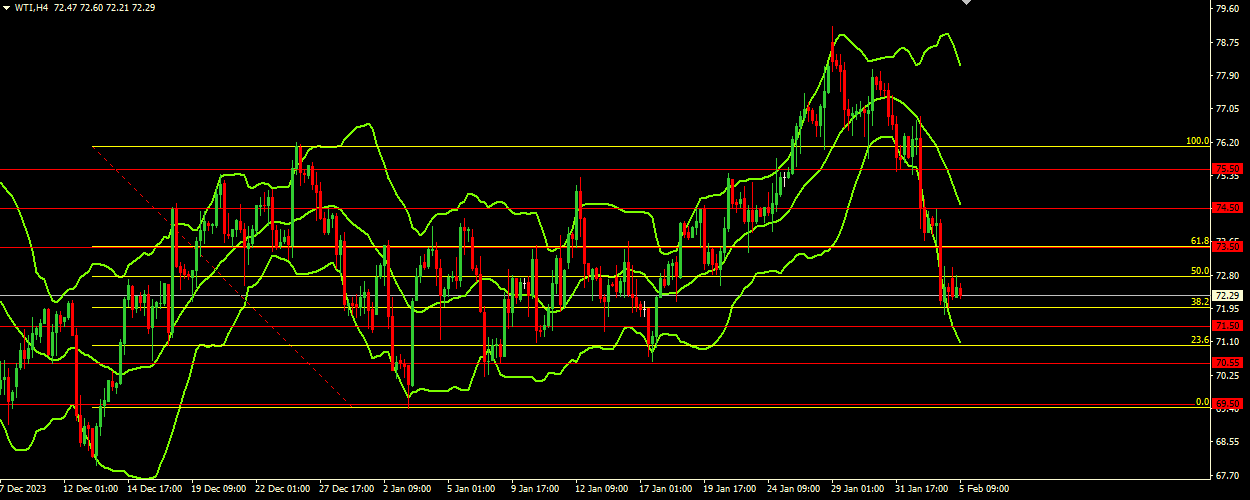
Technical analysis and scenarios:
Currently, the Bollinger Bands indicate a wide price range, with the upper band at 78.10, the middle band at 74.60, and the lower band at 71.05. The wide range indicates significant volatility in the market. Price is declining in the lower range of the Bollinger Bands, indicating bearish momentum. As price is closer to the lower band and the bands are pointing downward, it suggests that downward pressure may persist in the market in the short term. Price positioning below the middle band (which acts as a moving average) further confirms the bearish sentiment in the market.
Main scenario (SELL)
Recommended entry level : 71.50
Take Profit: 70.55
Stop loss: 72.00
Alternative scenario (BUY)
Recommended entry level: 73.50
Take Profit: 74.50
Stop loss: 73.00