
USDCAD H1: The Ichimoku Forecast for the Asian Session on 4.11.2024
02.11.2024 01:01
Teknikal
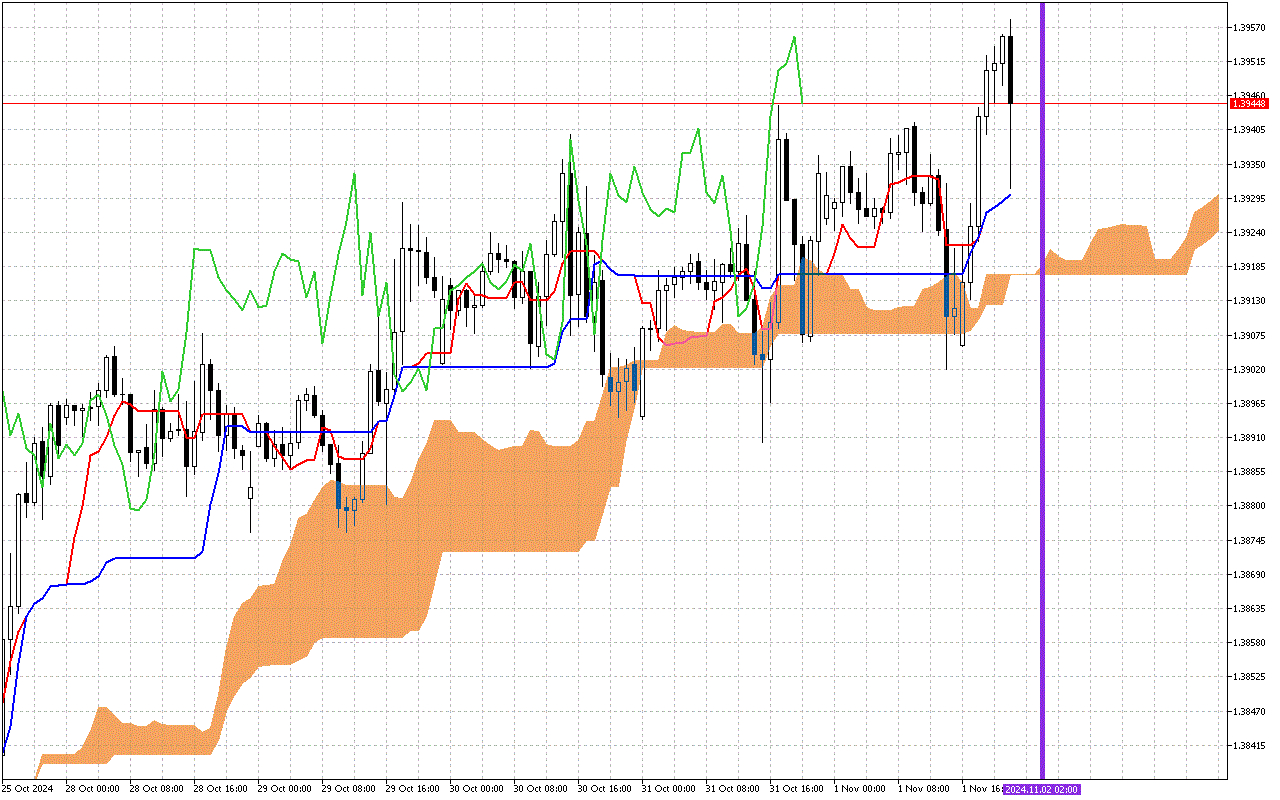
When analyzing the USDCAD chart, first of all, attention should be paid to the location of the Tenkan and Kijun lines. Price consolidation in recent trading sessions has made the lines intertwine. This situation shows there is now uncertainty in the market regarding the further direction of movement of USDCAD.
The second important signal is a change in the direction of movement of the Kumo cloud. This change is marked with a vertical purple line on the chart. The appearance of orange color in the cloud indicates a change in the main direction of movement to upward.
The current situation:
Let's carefully look at the current values of the main components of the Ichimoku indicator to assess the current state of the market:
The price is positioned below the Tenkan and the Kijun lines, which are now at the same price level.
The dynamics of price movement over a longer distance is determined by the Kumo cloud, which is now colored orange. Thus, this signal prioritizes the upward vector of price movement in the future.
Currently, the Kumo cloud lines represent a dynamic support area for price.
Used by investors to identify a change in trend, the green Chinkou line is held below the price on the chart.
Trading recommendations:
The second important signal is a change in the direction of movement of the Kumo cloud. This change is marked with a vertical purple line on the chart. The appearance of orange color in the cloud indicates a change in the main direction of movement to upward.
The current situation:
Let's carefully look at the current values of the main components of the Ichimoku indicator to assess the current state of the market:
The price is positioned below the Tenkan and the Kijun lines, which are now at the same price level.
The dynamics of price movement over a longer distance is determined by the Kumo cloud, which is now colored orange. Thus, this signal prioritizes the upward vector of price movement in the future.
Currently, the Kumo cloud lines represent a dynamic support area for price.
Used by investors to identify a change in trend, the green Chinkou line is held below the price on the chart.
Trading recommendations: