
XAUUSD H1: The Chaos Theory Forecast for the Asian Session on 2.12.2024
30.11.2024 01:16
Teknikal
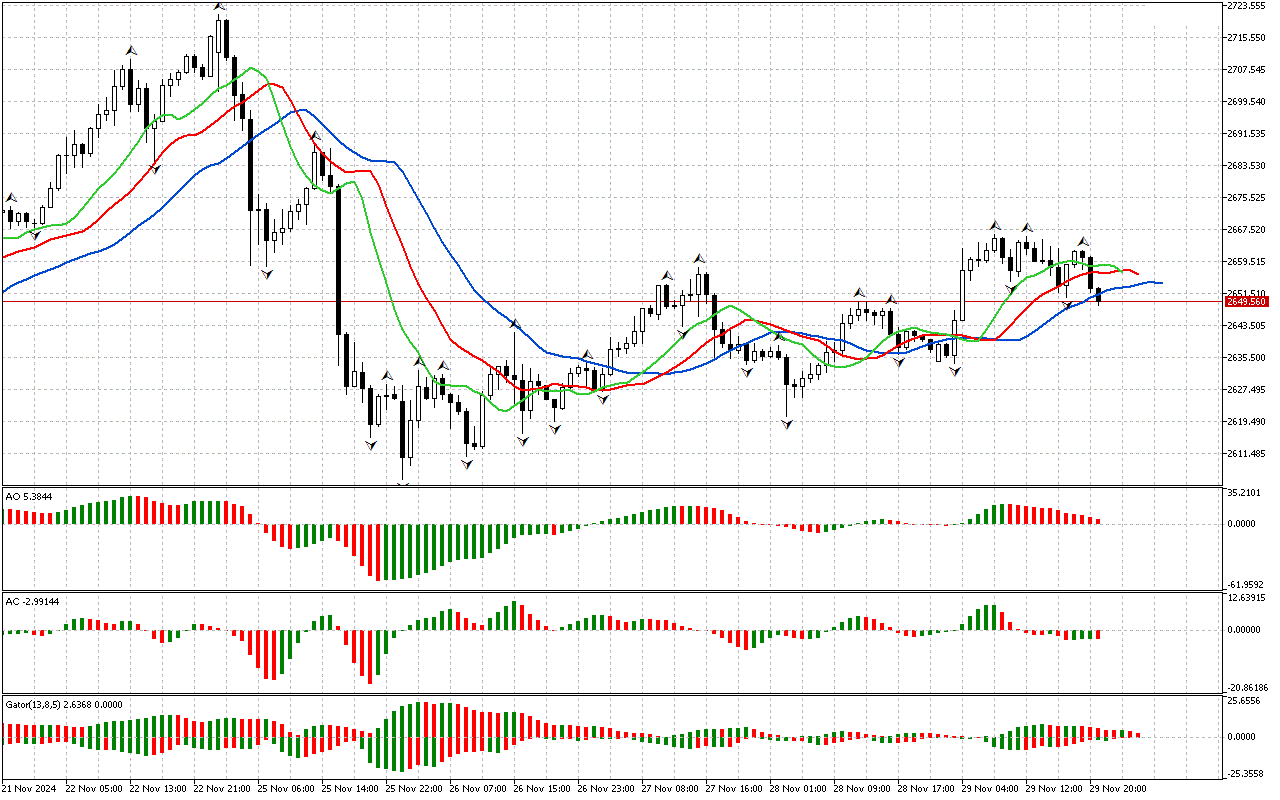
The review of the XAUUSD chart traditionally begins with the analysis of the first dimension of the market. The price has risen above the upper fractal. It means the phase space is defined as southern. Accordingly, now other market dimensions can be examined to assess the opportunities for trading positions opening.
At the same time, the Awesome Oscillator histogram is currently above the zero line.
The green bars located above the zero mark on the Accelerator Oscillator indicator show a decrease in the energy of the downward impulse. However, as long as the price remains below the Alligator’s red line, the price decrease is expected.
The color of the histograms of the Gator indicator changes, so this indicator has not formed a clear signal yet.
To sum up, the phase space is noted to be southern, but the indicators show a signal about the possible development of a pullback movement. This possibility can be used to find entry points in the direction of the main movement at more beneficial prices.
📊 Sell Stop 2648.600
❌ Stop Loss 2654.319
After entering the market, Stop Loss is moved along the red line after closing each candle. The profit is fixed by moving Stop Loss, or when opposite signals appear on the AO, AC, Gator indicators.
At the same time, the Awesome Oscillator histogram is currently above the zero line.
The green bars located above the zero mark on the Accelerator Oscillator indicator show a decrease in the energy of the downward impulse. However, as long as the price remains below the Alligator’s red line, the price decrease is expected.
The color of the histograms of the Gator indicator changes, so this indicator has not formed a clear signal yet.
To sum up, the phase space is noted to be southern, but the indicators show a signal about the possible development of a pullback movement. This possibility can be used to find entry points in the direction of the main movement at more beneficial prices.
📊 Sell Stop 2648.600
❌ Stop Loss 2654.319
After entering the market, Stop Loss is moved along the red line after closing each candle. The profit is fixed by moving Stop Loss, or when opposite signals appear on the AO, AC, Gator indicators.