
GBPUSD H1: The Ichimoku Forecast for the European Session at 28.1.2025
28.01.2025 09:16
Teknikal
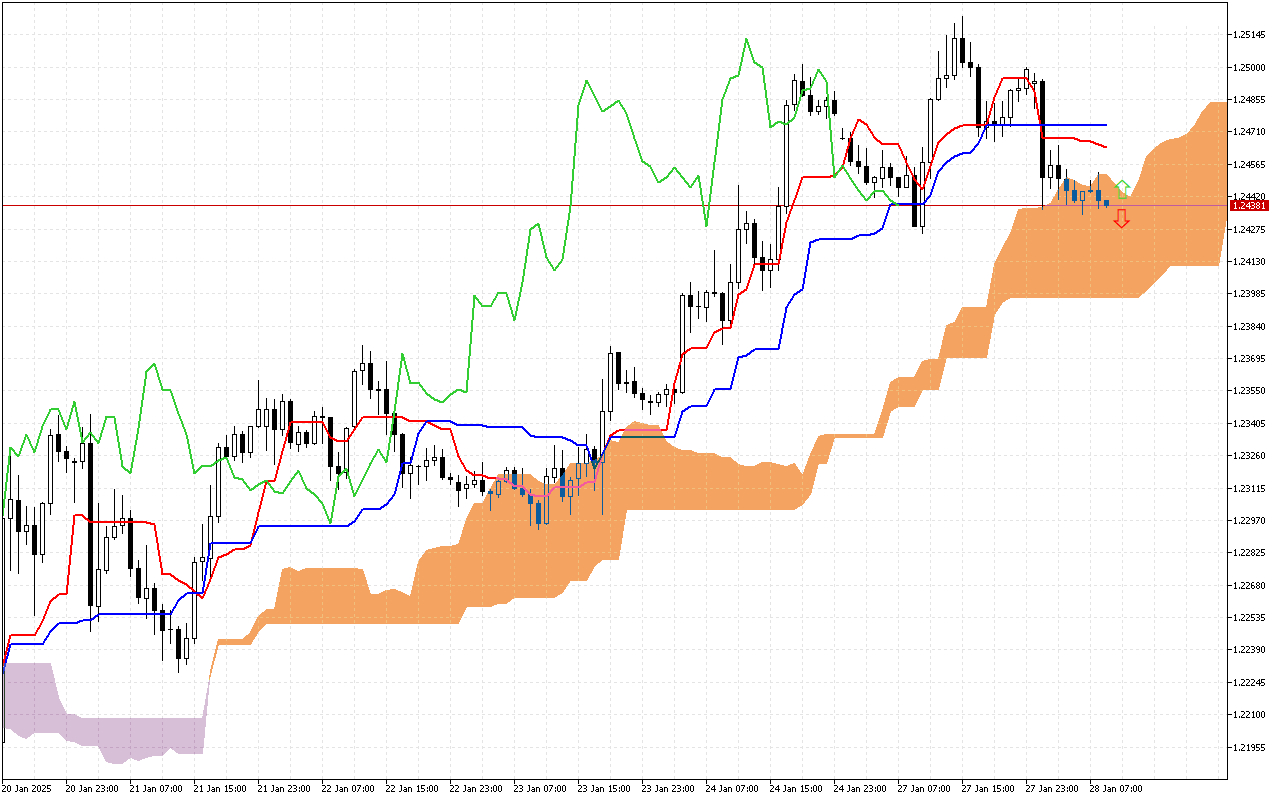
During previous trading sessions, the intersection of the Tenkan and Kijun lines, marked with a pink square, was observed on the GBPUSD chart. This signal indicates a potential change in the downward trend.
The current situation:
Let's carefully look at the current values of the main components of the Ichimoku indicator to assess the current state of the market:
The Tenkan and the Kijun lines are positioned above the current price. It indicates a negative market sentiment in the moment.
The dynamics of price movement over a longer distance is determined by the Kumo cloud, which is now colored orange. Thus, this signal prioritizes the upward vector of price movement in the future.
The price is between the SenkouA and SenkouB lines, which act as support and resistance levels. To clarify the market situation, it is worth waiting until the price goes beyond the Kumo cloud.
Used by investors to identify a change in trend, the green Chinkou line is held below the price on the chart.
Trading recommendations:
The dynamic support level is on the SenkouB line, around the 1.23970 mark.
Dynamic resistance levels are on the Tenkan line, around the 1.24655, the Kijun line, around the 1.24741, and the SenkouA line, around 1.24520.
The current situation:
Let's carefully look at the current values of the main components of the Ichimoku indicator to assess the current state of the market:
The Tenkan and the Kijun lines are positioned above the current price. It indicates a negative market sentiment in the moment.
The dynamics of price movement over a longer distance is determined by the Kumo cloud, which is now colored orange. Thus, this signal prioritizes the upward vector of price movement in the future.
The price is between the SenkouA and SenkouB lines, which act as support and resistance levels. To clarify the market situation, it is worth waiting until the price goes beyond the Kumo cloud.
Used by investors to identify a change in trend, the green Chinkou line is held below the price on the chart.
Trading recommendations:
The dynamic support level is on the SenkouB line, around the 1.23970 mark.
Dynamic resistance levels are on the Tenkan line, around the 1.24655, the Kijun line, around the 1.24741, and the SenkouA line, around 1.24520.