
EURUSD H1: The Chaos Theory Forecast for the European Session at 24.3.2025
24.03.2025 09:31
Teknikal
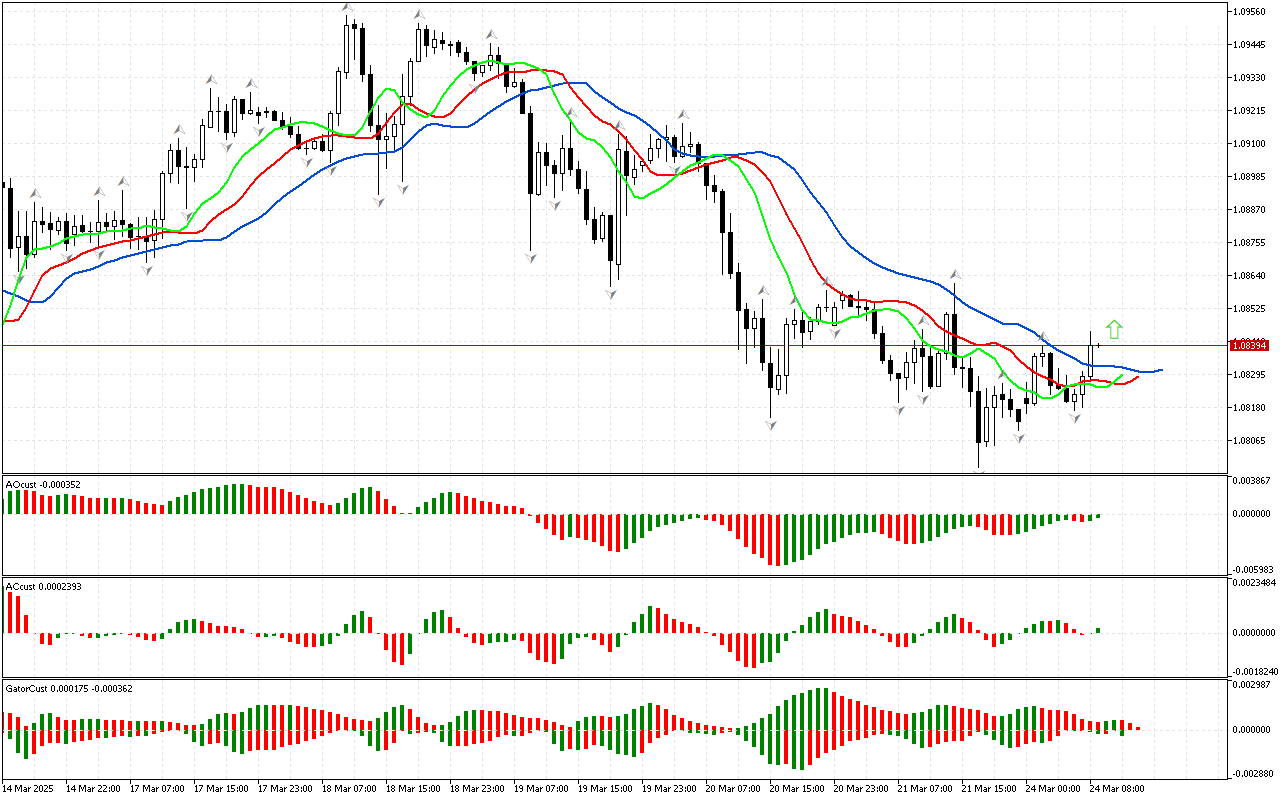
First of all, let's examine the first market dimension which is a key point in determination the further strategy of behavior of a trader or investor within the framework of Bill Williams' strategy. The price has risen above the upper fractal on the current chart. This defines the phase space as northern. It may indicate the formation of an upward movement. To assess its potential, the signals from other market dimensions should be examined.
At the same time, the AO indicator remains in the negative zone.
In general, the signals from the AC and AO indicators show that there is sufficient strength and energy in the market to continue the upward movement.
The color of the histograms of the Gator indicator changes, so this indicator has not formed a clear signal yet.
As a result, there is a northern phase space. At the same time, some indicators indicate the possible development of a pullback movement or the transition of the market to a new phase.
📊 Buy Stop 1.08444
❌ Stop Loss 1.08295
After entering the market, Stop Loss is carried along the red line after the closing of each candle. The profit is fixed by moving Stop Loss, or when opposite signals appear on the AO, AC, Gator indicators.
At the same time, the AO indicator remains in the negative zone.
In general, the signals from the AC and AO indicators show that there is sufficient strength and energy in the market to continue the upward movement.
The color of the histograms of the Gator indicator changes, so this indicator has not formed a clear signal yet.
As a result, there is a northern phase space. At the same time, some indicators indicate the possible development of a pullback movement or the transition of the market to a new phase.
📊 Buy Stop 1.08444
❌ Stop Loss 1.08295
After entering the market, Stop Loss is carried along the red line after the closing of each candle. The profit is fixed by moving Stop Loss, or when opposite signals appear on the AO, AC, Gator indicators.