
EURUSD H1: The Ichimoku Forecast for the European Session at 27.3.2025
27.03.2025 09:16
Teknikal
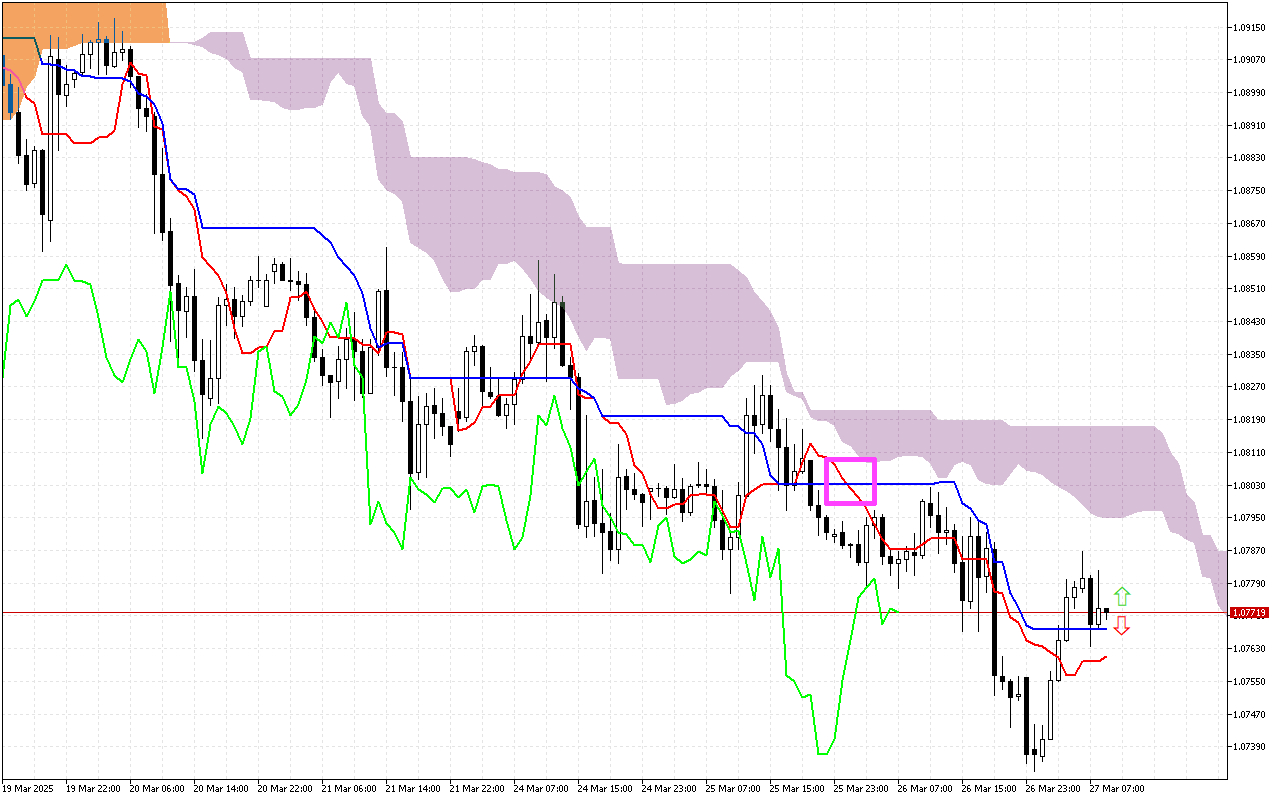
Analyzing previous trading sessions, it is worth paying attention to the intersection of the Tenkan and Kijun lines, marked with a pink square. The fast Tenkan line fell below the Kijun line, which usually signals a change in trend to a downward one. However, later the price rose above the Tenkan line, which indicates the weakness of the downward impulse.
The current situation
Let's carefully look at the current values of the main components of the Ichimoku indicator to assess the current state of the market:
The Tenkan line remains below the Kijun line. However, the price has broken above both lines and moved higher.
Now the Kumo cloud is tinted lilac, which indicates a possible change in price dynamics in a negative direction.
In the current market profile, the price has fixed below the Kumo cloud. The boundaries of the cloud form a dynamic resistance zone for the price.
The Chikou line, which displays the closing price with a lag of 26 periods, is above the current price.
Trading recommendations:
The dynamic support level is on the Tenkan line, around the 1.07598 mark.
Dynamic resistance levels are located on the Kijun line, near the 1.07676, the SenkouA line, at the 1.07952 mark, and the SenkouB line, near the 1.08173 mark.
The main Ichimoku system indicators prioritize searching for entry points into short positions, on a price rollback to the resistance levels.
The current situation
Let's carefully look at the current values of the main components of the Ichimoku indicator to assess the current state of the market:
The Tenkan line remains below the Kijun line. However, the price has broken above both lines and moved higher.
Now the Kumo cloud is tinted lilac, which indicates a possible change in price dynamics in a negative direction.
In the current market profile, the price has fixed below the Kumo cloud. The boundaries of the cloud form a dynamic resistance zone for the price.
The Chikou line, which displays the closing price with a lag of 26 periods, is above the current price.
Trading recommendations:
The dynamic support level is on the Tenkan line, around the 1.07598 mark.
Dynamic resistance levels are located on the Kijun line, near the 1.07676, the SenkouA line, at the 1.07952 mark, and the SenkouB line, near the 1.08173 mark.
The main Ichimoku system indicators prioritize searching for entry points into short positions, on a price rollback to the resistance levels.