
Fundamental and technical analysis of XAUUSD for 31.05.2023
A brief review of macroeconomic news:
The U.S. Federal Reserve (Fed) confirmed its intention to try to move to a more moderate monetary policy, which supports the demand for gold as a protective asset. This could put pressure on the dollar, which in turn supports gold prices.
According to the International Monetary Fund (IMF), U.S. inflation continues to rise, which may also stimulate demand for gold as an inflationary hedge.
The precious metals market has seen an increase in demand for gold in India and China, supporting XAU prices in the near term.
However, despite the growth in demand for gold, some analysts warn of the possibility of a correction in gold prices due to the likely strengthening of the dollar amid strong macroeconomic statistics and rising U.S. government bond yields.
The impact of the macroeconomic statistics:
Nonfarm payrolls from ADP (May): The actual data exceeded the forecast, indicating that the U.S. economy is strengthening and could put pressure on gold, strengthening the dollar.
Initial Jobless Claims: Data came in below expectations, signaling improving US economic conditions and potentially putting pressure on gold.
ISM Manufacturing PMI (May): The actual data was lower than forecast, which could indicate slower economic growth and support gold prices.
Crude Oil Inventories: Oil inventory build-up may signal weaker demand, which could weigh on the dollar and support gold prices.
Average Hourly Earnings (MoM) (May): If actual data exceeds forecast, this could indicate a strengthening U.S. economy and put pressure on gold.
Nonfarm payrolls (May): If the actual data exceeds the forecast, this could indicate a strengthening U.S. economy and put pressure on gold.
Unemployment Rate (May): If actual data is higher than forecast, this could indicate a strengthening U.S. economy and put pressure on gold.
Technical analysis and scenarios:
The Ichimoku Kinko Hyo indicator shows an uptrend for the XAU/USD pair. The Tenkan-sen line (1968.37) is above the Kijun-sen line (1957.70), which is confirmation of the uptrend. The pair is traded above these lines, which indicates that gold has strengthened against the dollar. The line Chikou span (1980.73) is above the price chart and trades sideways, which also indicates an uptrend. The cloud has reversed from a downtrend to an uptrend, confirming an uptrend.
Support levels: 1933.52, 1941.85, 1948.36, 1964.50
Resistance levels: 1987.40, 1996.50, 2001.20, 2011.85
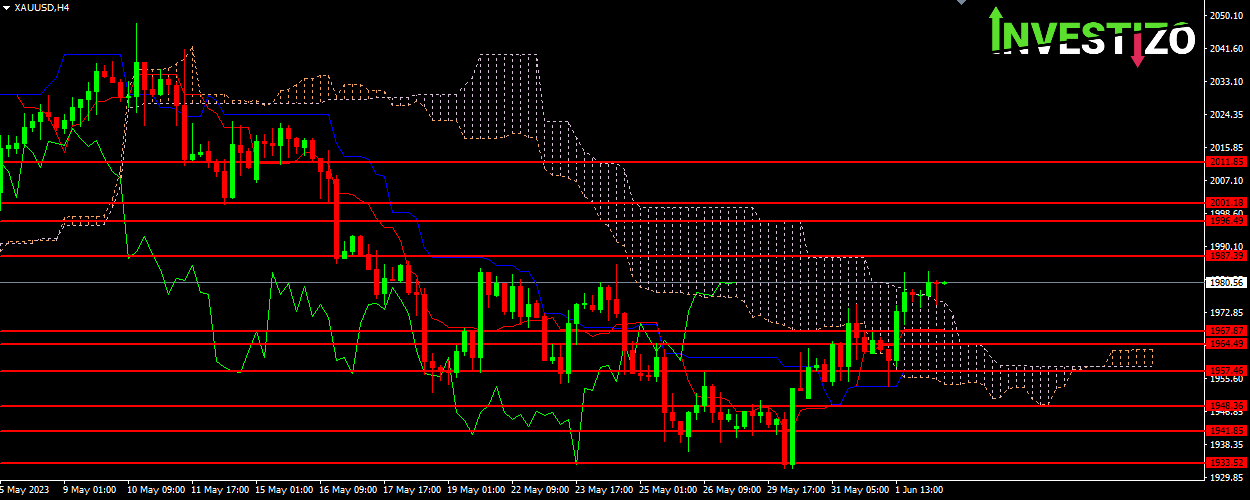
Main scenario: If the current uptrend persists, the resistance level of 1987.40 may become a buy target. If the pair overcomes this level, the next targets will be 1996.50 and 2001.20. Take profit can be placed at the level of 2001.20 and stop loss - at the level of support 1964.50.
Alternative scenario: If the pair breaks through the support level 1964.50, it may indicate a possible beginning of a downtrend. In this case, the support level of 1948.36 could be a sell target. If the pair breaks through this level, the next targets will be 1941.85 and 1933.52. Take profit can be placed at the level of 1933.52, while the stop loss can be placed at the resistance level of 1987.40.