
Fundamental analysis of USD/JPY
USD/JPY declined after a short-term recovery near 138.500. This downtrend is the result of lower inflation in the US, which convinces investors that the Federal Reserve may raise interest rates again later this year.
The US Dollar Index (DIX) hit a new yearly low at 100.34 as a weak Consumer Price Index (CPI) report in June overshadowed hawkish remarks from Federal Reserve officials. Going forward, investors will keep an eye on the Producer Price Index (PPI) data for June. The monthly core and gross PPI are expected to increase 0.2%, while the annual PPI is expected to decline 0.4% from the previously announced 1.1%. A large decline in out-of-the-money prices would ease inflationary pressures and signal a contraction in aggregate demand.
Meanwhile, potential changes to the Bank of Japan's (YCC) yield curve control policy provide support for the Japanese yen, spurred by rising demand for wage hikes, signaling the possibility of a move away from extreme measures. In the absence of key economic data from Japan that could influence the BoJ's extremely loose monetary policy, trade data from China could be the catalyst for directional movement. Negative data is likely to further depress USD/JPY.
The US economic calendar includes US peak inflation data and weekly jobless claims for June. An increase in inflation or an unexpected drop in jobless claims could create uncertainty in the market. After the US CPI report, markets have become more optimistic about the Fed's monetary policy targets.
Technical analysis and scenarios:
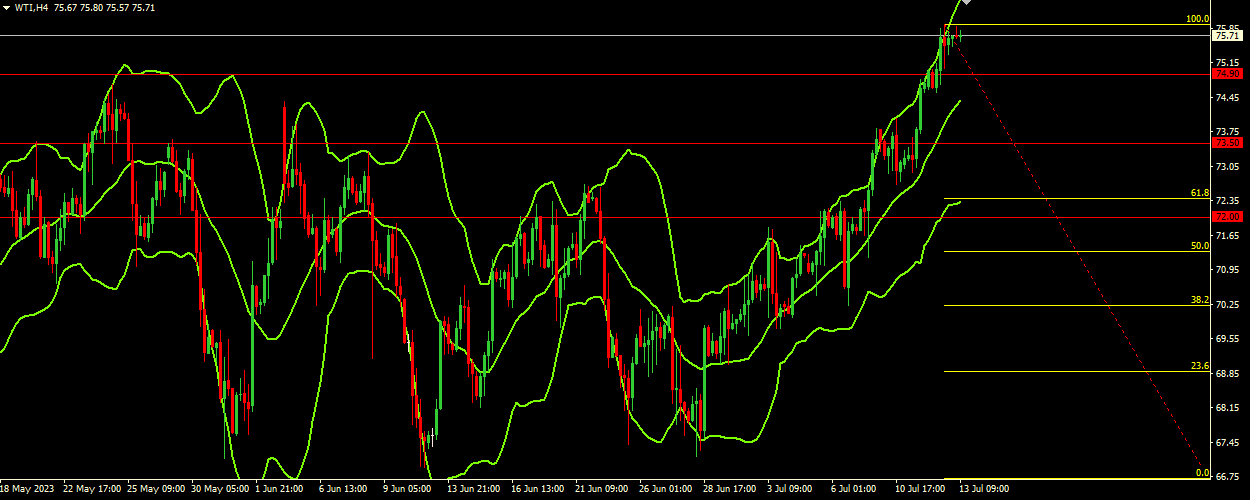
Indicators are currently giving bearish signals:
The Stochastic oscillator is showing a value of 26.8873, above the signal line of 24.2065, indicating a possible overbought market, suggesting a possible downward move. The Bollinger Bands indicate a downward direction with a wide price range. As the current price is trading near the lower band (137.420), it suggests that the market is potentially oversold. This could hint at a possible bounce or price correction in the short term, but prolonged trading within the lower band could also reinforce the bearish trend. MACD has a value of -1.2227, which is below the signal line at -1.1412, indicating bearish momentum.
Main Scenario (SELL)
Recommended entry level: 138.000.
Take Profit: 137.500.
Stop Loss: 138.200.
Alternative scenario (BUY)
Recommended entry level: 139.000.
Take Profit: 139.500.
Stop loss: 138.800.