
Fundamental analysis of AUD/USD
The AUD/USD pair is recovering in growth after a decline due to the publication of weak data on consumer inflation in Australia and is currently trading at 0.67650. The growth was also supported by the decision of the Chinese Politburo, which pledged to support the struggling Chinese economy, which has a positive impact on commodity prices.
The Australian Bureau of Statistics reported that the consumer price index for Q2 came in at 0.8%, down from the expected 1% and well below the 1.4% in the previous period. In addition, the annualized figure was also below market expectations, falling from 7.0% to 6.2% year-on-year. The Reserve Bank of Australia's (RBA) preferred average consumer price index rose at an annualized rate of 5.9% in the June quarter versus 6.6% in the previous quarter.
U.S. consumer confidence hit a two-year high in July, while a still-tight labor market and falling inflation are raising recession hopes. However, dollar bulls are holding off on new bets for now, awaiting clarification on Federal Reserve (Fed) policy. The two-day FOMC monetary policy meeting will take place on Wednesday. However, doubts remain as to whether the Fed will take a more accommodative stance. All eyes will be on the accompanying monetary policy statement and Fed Chairman Jerome Powell's comments at the post-meeting press conference, looking for clues as to the future path of rate hikes, which will influence the impact on the price of the US dollar and hence the bias towards higher interest rates.
Meanwhile, a rebound in global stock markets, driven by optimism over potential stimulus packages from China, supported the risk-sensitive Australian currency and limited the upside for the US Dollar. The impact of the US housing data on AUD/USD will be very minor as the focus will be on the Fed's rate decision and subsequent press conference.
Technical analysis and scenarios:
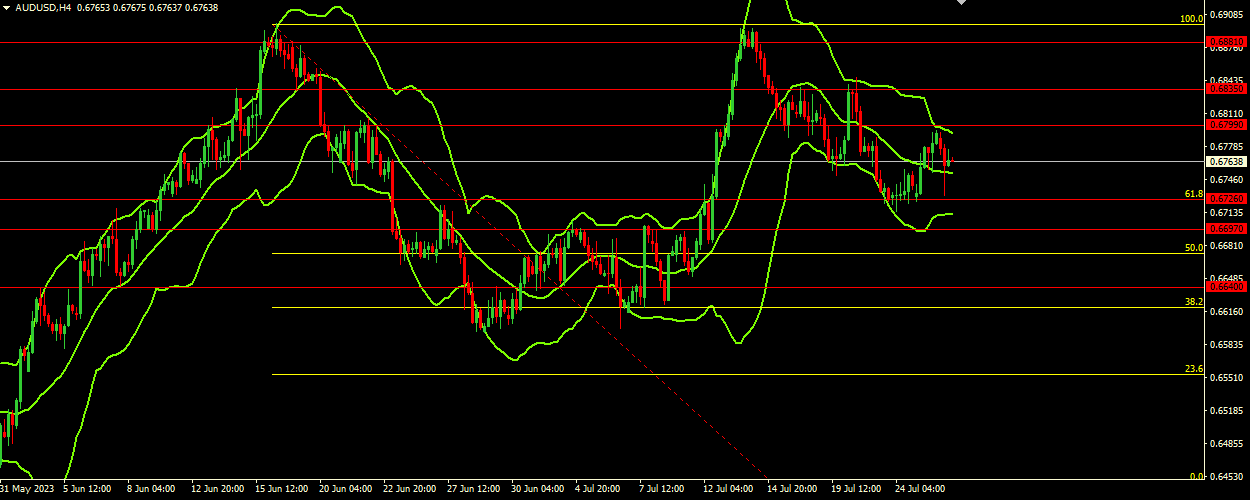
AUD/USD is currently trading above the middle Bollinger Band at 0.67520, indicating a possible bullish bias in the short term. The upper Bollinger band is at 0.67940, which could act as the first significant resistance level. As the Bollinger Bands are widening, it indicates increased market volatility, which means a strong move is expected. The nearest support level is at 0.67260, followed by 0.66970 and 0.66400. On the upside, the resistance level is at 0.67990, followed by 0.68350 and 0.68810.
Main scenario (BUY)
Recommended entry level: 0.67990.
Take profit: 0.68350.
Stop loss: 0.67800.
Alternative scenario (SELL)
Recommended entry level: 0.67260.
Take Profit: 0.66970.
Stop loss: 0.67500.