
GBPUSD H1: The Chaos Theory Forecast for the European Session at 19.12.2024
19.12.2024 09:16
Técnico
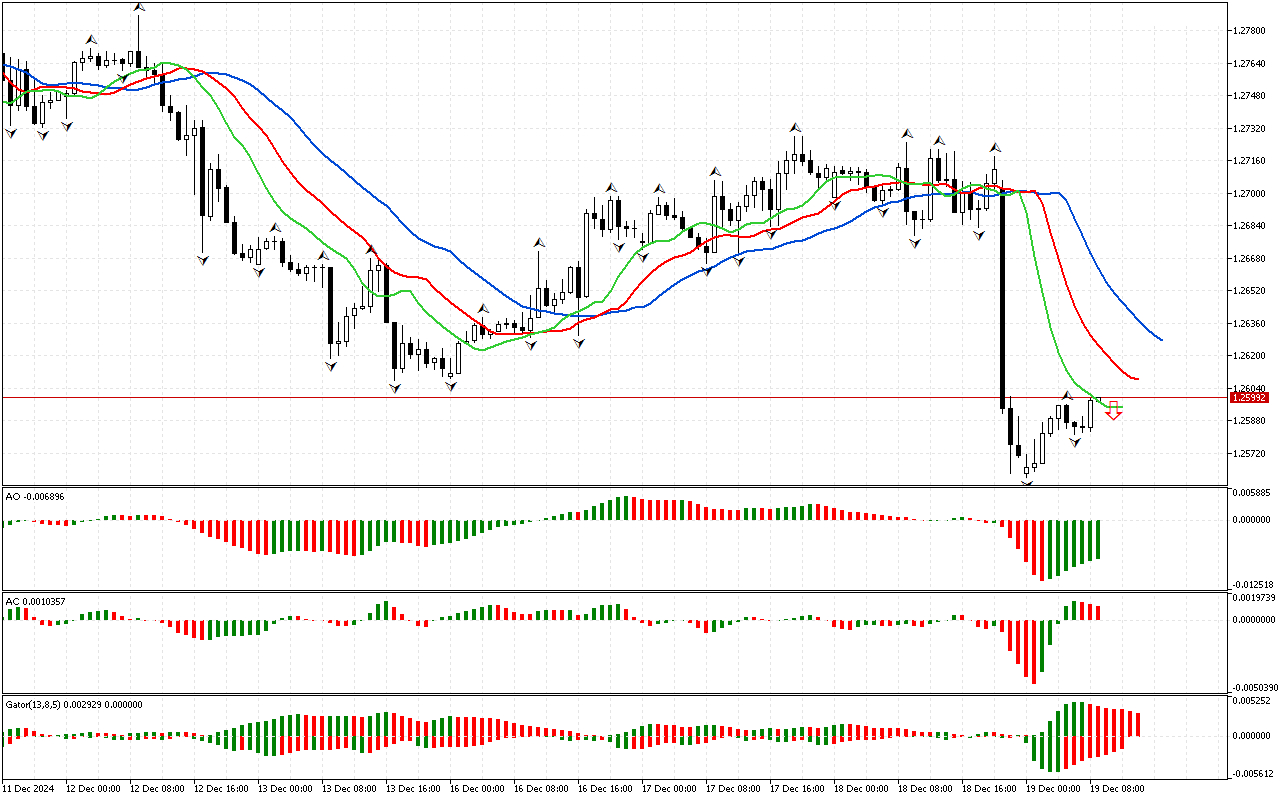
The review of the GBPUSD chart traditionally begins with the analysis of the first dimension of the market. The price has fallen below the lower fractal. It means the phase space is defined as southern. Accordingly, now other market dimensions can be examined to assess the opportunities for trading positions opening.
The Alligator confirms the signal of the first phase of the market: its mouth is open.
The Awesome Oscillator indicator has consolidated below the zero mark.
There are red bars, drawn above the zero line on the AC indicator. This signals an increase in energy for movement to the southern direction.
The histogram of the Gator indicator has not formed a clear signal yet. The color of the histograms changes, indicating a change in market phase.
A series of red bars is drawn on the Gator indicator. This signal shows the formation of a correction.
To sum up, the phase space is defined as southern. The same direction of movement is predominantly proved by other indicators. Against this background, intraday it is worth prioritizing short positions.
📊 Sell Stop 1.25810
❌ Stop Loss 1.26435
After entering the market, Stop Loss is moved along the red line after closing each candle. The profit is fixed by moving Stop Loss, or when opposite signals appear on the AO, AC, Gator indicators.
The Alligator confirms the signal of the first phase of the market: its mouth is open.
The Awesome Oscillator indicator has consolidated below the zero mark.
There are red bars, drawn above the zero line on the AC indicator. This signals an increase in energy for movement to the southern direction.
The histogram of the Gator indicator has not formed a clear signal yet. The color of the histograms changes, indicating a change in market phase.
A series of red bars is drawn on the Gator indicator. This signal shows the formation of a correction.
To sum up, the phase space is defined as southern. The same direction of movement is predominantly proved by other indicators. Against this background, intraday it is worth prioritizing short positions.
📊 Sell Stop 1.25810
❌ Stop Loss 1.26435
After entering the market, Stop Loss is moved along the red line after closing each candle. The profit is fixed by moving Stop Loss, or when opposite signals appear on the AO, AC, Gator indicators.