
Bitcoin H1: The Ichimoku Forecast for the Asian Session on 19.1.2025
19.01.2025 00:16
Técnico
Analysis of the market situation, developed in previous trading sessions, shows the intersection of the Tenkan and Kijun lines. Typically, this signal indicates an upcoming increase, but subsequently the price fell below the Tenkan line.
The current situation:
Let's look at the main components of the indicator and their current values:
The Tenkan line remains above the Kijun line, but the price has fallen below these lines and is now holding below them.
The Kumo cloud is colored orange, indicating the market tendency to a continuing upward movement.
In addition, the price is above the Kumo cloud, which acts as a potential support zone.
The Chinkou line is now below the current price.
Trading recommendations:
Dynamic support levels are located on the Kijun line, near the 104013.30, the SenkouA line, at the 103204.32, and the SenkouB line, near the 101538.95.
The dynamic resistance level is on the Tenkan line, around the 104024.20 mark.
The indicator signals predominantly support the upward vector of movement, so the upward bounce from the defined support levels signals are prioritized intraday.
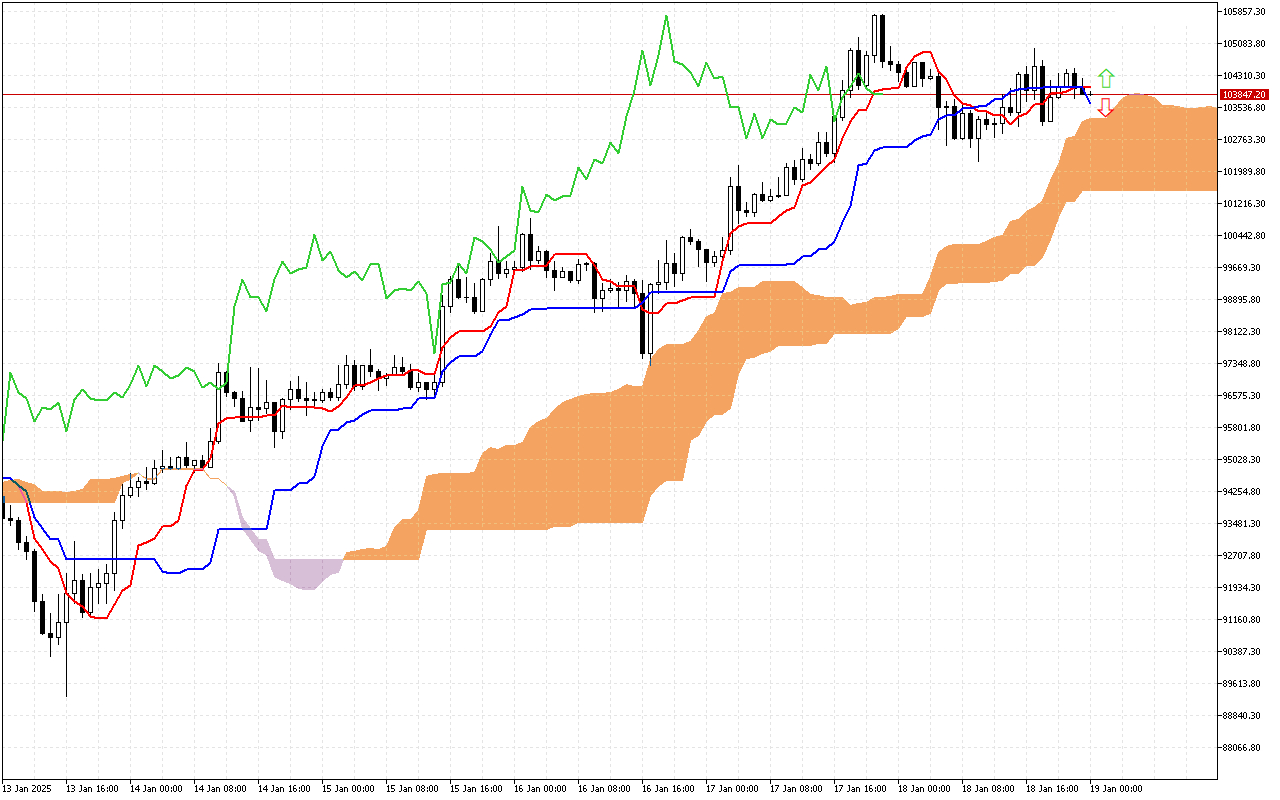
The current situation:
Let's look at the main components of the indicator and their current values:
The Tenkan line remains above the Kijun line, but the price has fallen below these lines and is now holding below them.
The Kumo cloud is colored orange, indicating the market tendency to a continuing upward movement.
In addition, the price is above the Kumo cloud, which acts as a potential support zone.
The Chinkou line is now below the current price.
Trading recommendations:
Dynamic support levels are located on the Kijun line, near the 104013.30, the SenkouA line, at the 103204.32, and the SenkouB line, near the 101538.95.
The dynamic resistance level is on the Tenkan line, around the 104024.20 mark.
The indicator signals predominantly support the upward vector of movement, so the upward bounce from the defined support levels signals are prioritized intraday.