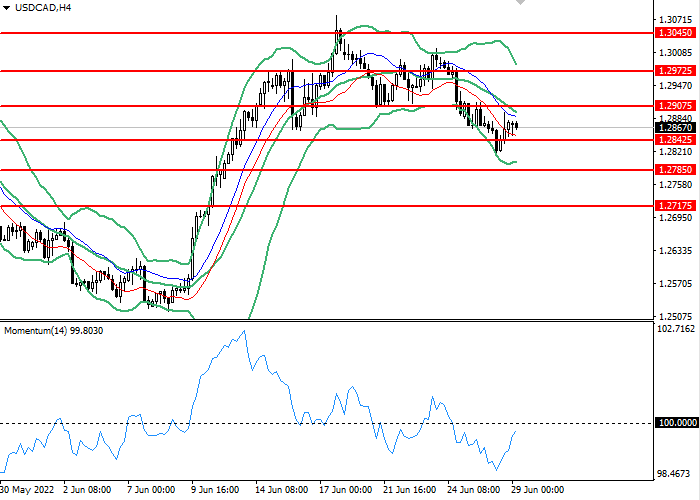
Current dynamics
The USD/CAD pair witnessed a decline at the beginning of today's trading session. This is after a slight correction that the pair had witnessed in the second half of its session on Tuesday. After a two-day downtrend, during which it recorded its lowest level in two weeks at 1,28190.
Some may attribute the Canadian dollar's recent gains were supported by bullish crude oil prices, as Canada is the largest oil producer in the US, but US data, as well as geopolitical and trade talks, supported bullish hopes for the dollar.Rising fears of a recession put additional pressure on market sentiment and supported demand for the safe haven US dollar.
Despite this, Federal Reserve member James Bullard played down the possibility of a recession in the United States, and Bullard added that the process of reducing inflation could be painful but the FOMC must continue to raise interest rates to prevent inflation expectations from becoming more entrenched.
And as US Federal Reserve member John Williams stressed on Tuesday that he expects the US economy to avoid a recession, although he sees the need for the US Federal Reserve to raise interest rates more to control inflation.
On the other hand, the data of the Consumer Confidence Index issued on Tuesday by the Conference Board showed negative index data during the current June, as the data showed that the index recorded about 98.7 points, declining less than the expectations of the markets, which were about 100.0 points, and also less than the previous reading, which recorded 103.2 point during May.
Data published by the US Census Bureau on Tuesday revealed that the US international trade deficit narrowed by $2.4 billion to $104.3 billion in May from $106.7 billion in April. The data showed that exports of goods for the month of May amounted to 176.6 billion dollars, an increase of 2.0 billion dollars over April exports. Merchandise imports for the month of May amounted to $280.9 billion, down $0.4 billion from April's imports.
Looking at the most important events affecting the pair, besides Fed Chair Powell's speech, investors' focus will also remain on US core personal spending data for the first quarter of 2022, which is expected to remain unchanged at 5.1%. Along with the final readings for the first quarter GDP, which is likely to confirm an annual contraction of 1.5%.
Support and resistance levels
On the 4 hour chart, the instrument is testing a consolidation at the moving average of the Bollinger Bands. The indicator is directed downward and the price range is narrowing, indicating that the current trend is about to change. The momentum chart is below the 100 level, which is giving buy signals. The Envelopes indicator gives sell signals.
- Support levels: 1.28425, 1.27850, 1.27175.
- Resistance levels: 1.29075, 1.29725, 1.30450.
Trading scenarios
- Short positions should be opened at 1.28425 with a target of 1.27850 and a stop loss at 1.28840. Implementation period: 1-3 days.
- Long positions can be opened above the level of 1.29075 with a target of 1.29725 and a stop-loss at the level of 1.28425. Implementation period: 1-3 days.
