
Gold (XAU/USD) Morning Brief: July 20, 2026
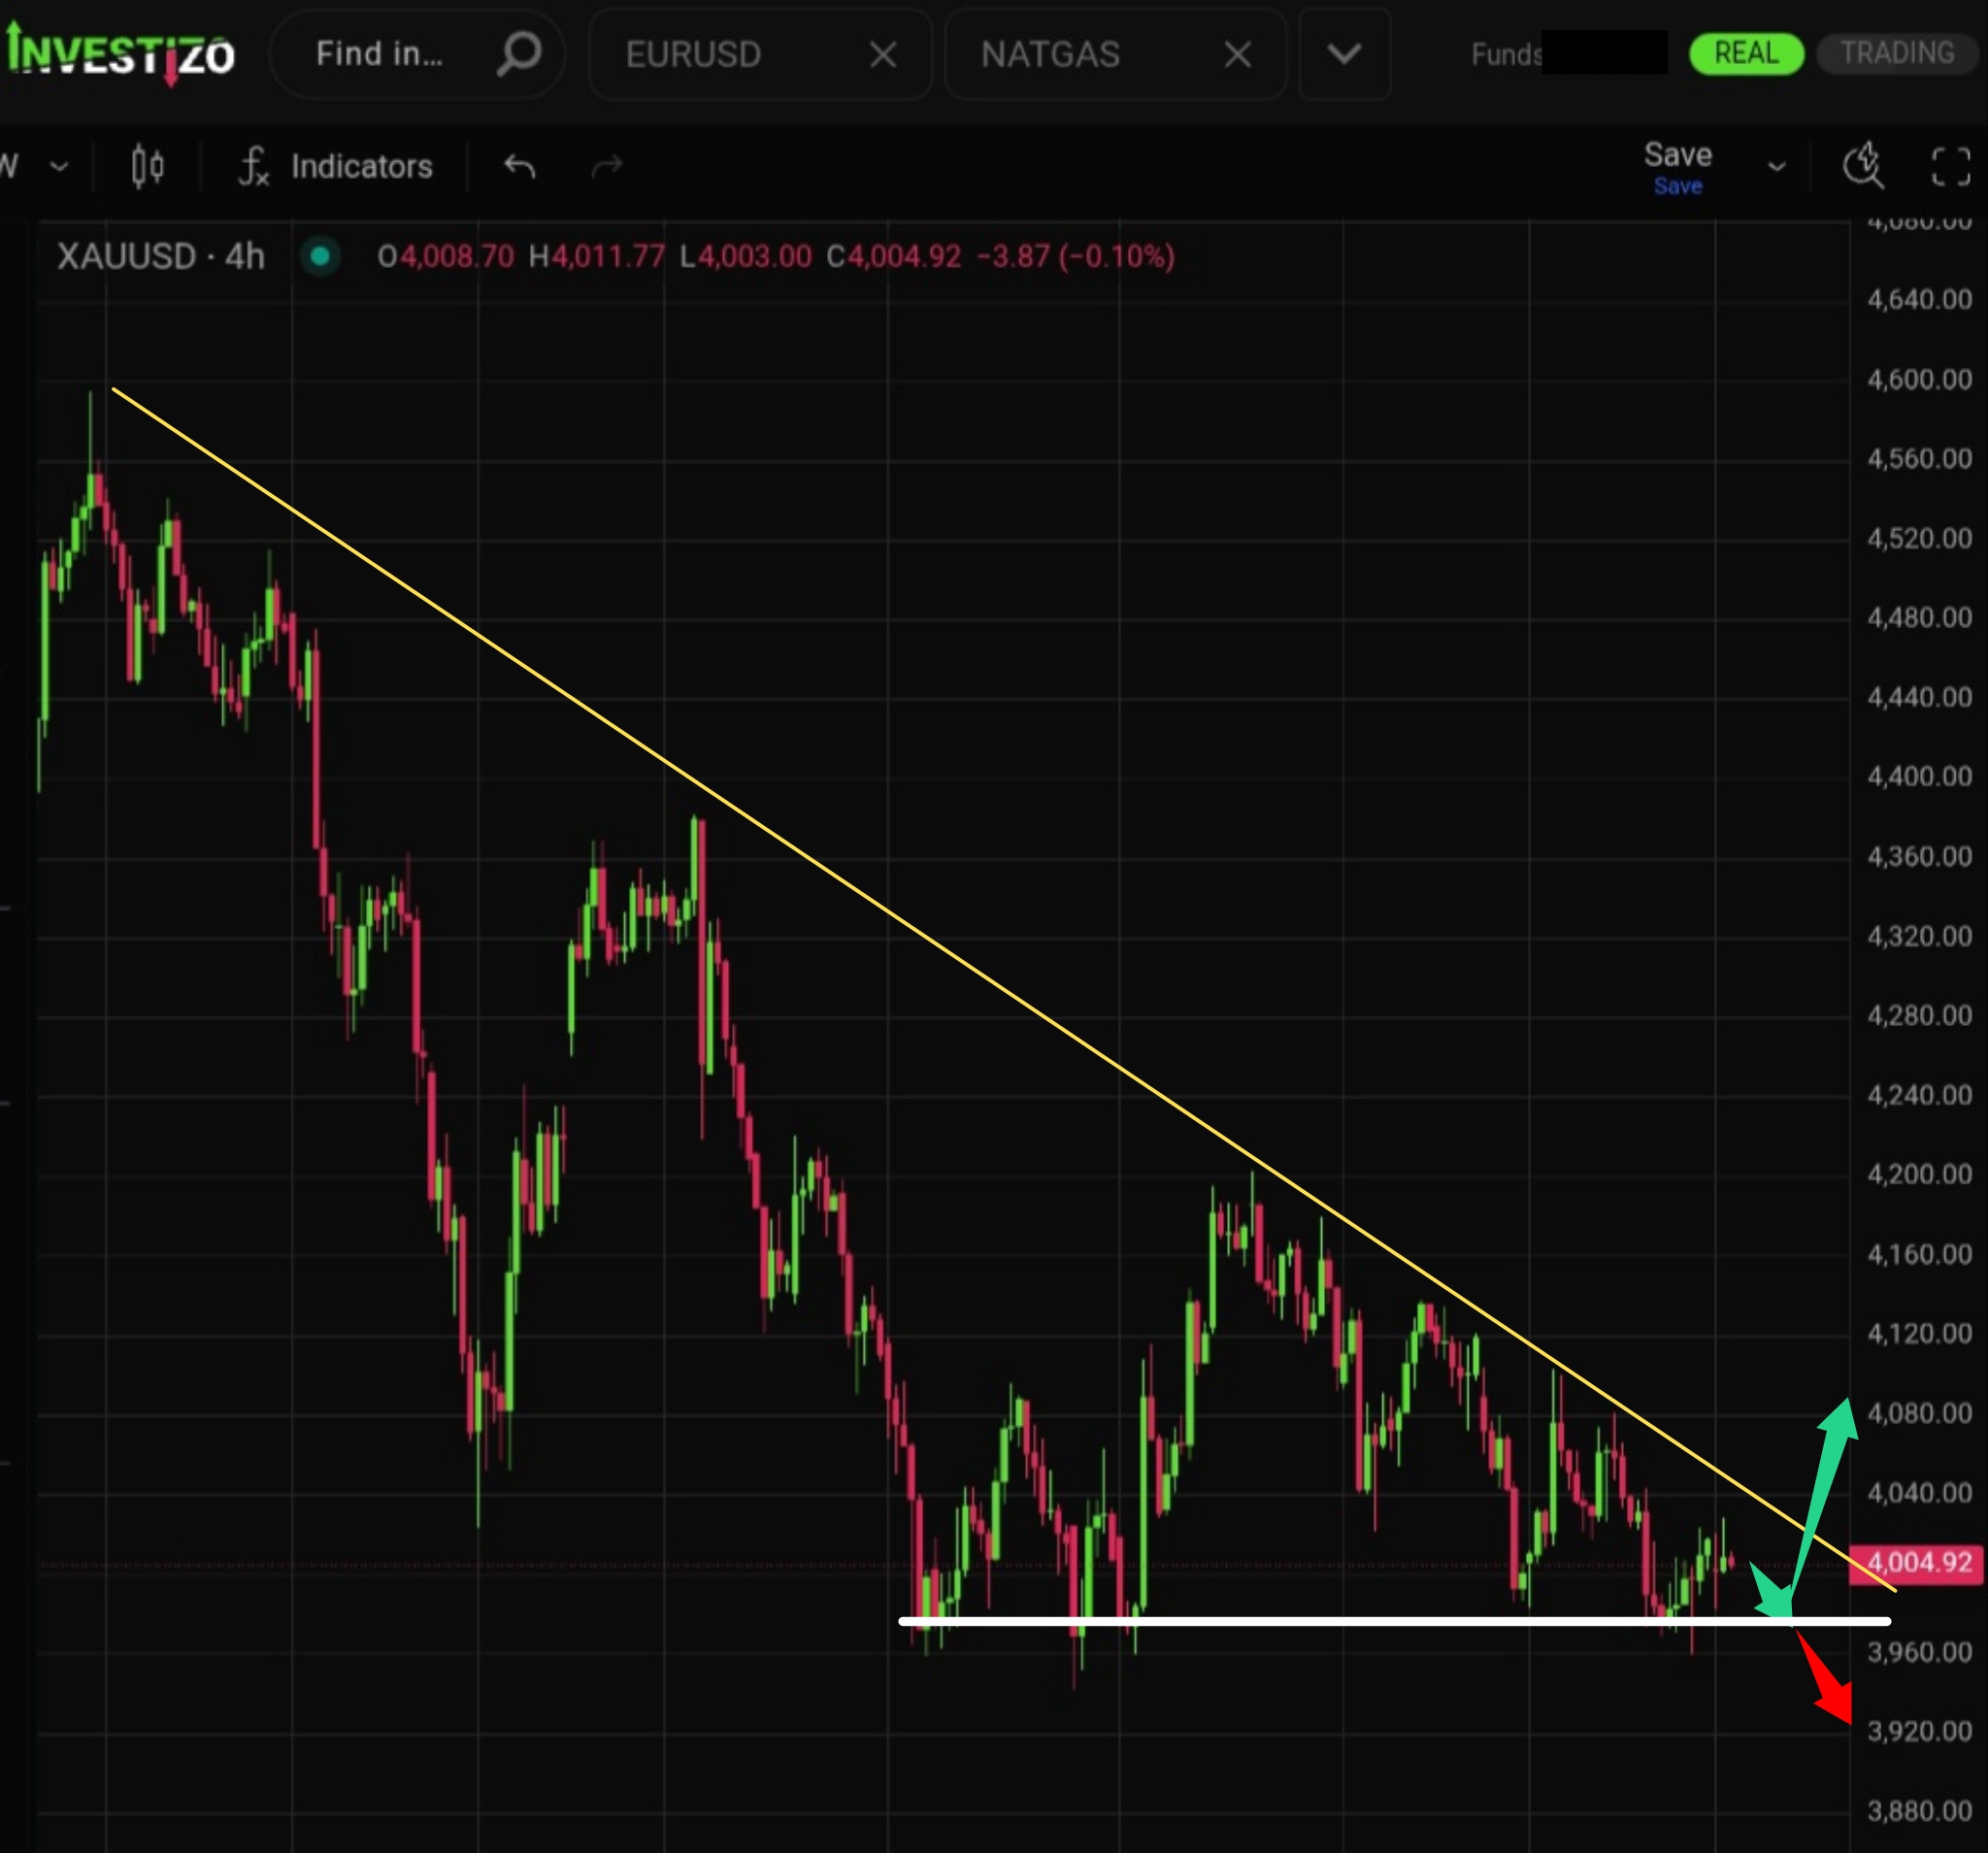
Gold trades at $4,005 this Monday morning, extending its sharpest weekly decline in six weeks. The precious metal remains technically suppressed, marking its 31st consecutive trading day below its 200-day moving average — the longest prolonged stretch beneath this major long-term indicator since 2022, highlighting the deep technical discount currently dictating short-term price action.
According to a Reuters report, the primary catalyst behind this multi-week liquidation is an increasingly hawkish repricing of Federal Reserve monetary policy. The violent escalation of the Middle East conflict has triggered widespread expectations of an energy-driven inflation resurgence, forcing macro markets to price in a higher-for-longer interest rate trajectory that directly erodes the appeal of non-yielding bullion. Despite the near-term weakness, institutional analysts point to significant latent liquidity that could alter market dynamics. Bloomberg reports that any exhaustion or structural reversal in the current semiconductor equity rally could redirect immense capital flows back into both Gold and Bitcoin. Goldman Sachs data highlights the potential scale of such a shift, noting that American investors currently hold a mere 0.18% of their portfolios in the yellow metal. According to their estimates, even a marginal 0.01% increase in this domestic allocation would trigger a 1.4% surge in the spot price, demonstrating a powerful 14x structural multiplier.
Market Overview: The immediate path of least resistance remains skewed to the upside for yields and downward for bullion as macroeconomic forces favor tighter monetary expectations. Sellers are currently testing major psychological support at $4,000, a decisive breach of which would open the door for an extended correction toward the $3,950 liquidity pocket. Conversely, to stabilize the tape and mount a meaningful counter-offensive, buyers must reclaim immediate technical resistance at $4,060 to clear the way for a broader test of the overhead 200-day moving average.