
Fundamental analysis of EUR/USD
The EUR/USD pair showed significant volatility during the week, falling to a low of $1.07861 before rising to 1.08917 on Tuesday. The pair is currently trading at 1.08750.
Key economic indicators and published data continue to capture investors' attention. Future business and consumer sentiment surveys in the Eurozone are likely to be in focus, especially given the latest GfK consumer confidence survey in Germany and deteriorating macroeconomic conditions. Another topic of interest is German inflation statistics. According to European Central Bank (ECB) officials, inflation is at alarmingly high levels and strong German inflation data could prompt the ECB to intervene further to curb inflation. Germany's consumer price index showed a 2pc gain from 6.8% to 7.0%. Higher inflation could push the EUR/USD exchange rate higher.
In the US, the focus is on economic indicators such as August non-farm payroll changes, second quarter GDP statistics, housing statistics and trade statistics. Any signs of deterioration in the labor market could lead to a slowdown in consumer spending, which in turn could dampen inflationary pressures. The U.S. dollar depreciated further due to disappointing U.S. economic results, particularly the drop in consumer confidence in August and the decline in JOLTS job openings in July.
In light of these economic revelations, Fed Chairman Jerome Powell emphasized at a symposium in Jackson Hole that future interest rate decisions will depend on macroeconomic data. Therefore, navigating this complex environment, traders remain wary of the release of new economic data from the U.S. and the Eurozone, which are designed to decipher the direction of inflation dynamics. Finally, the US Dollar Index (DXY) is currently hovering around 103.66, attempting to recover from its recent downtrend. Weak US Treasury yields, especially 10-year Treasuries, continue to weigh on the dollar.
Technical analysis and scenarios:
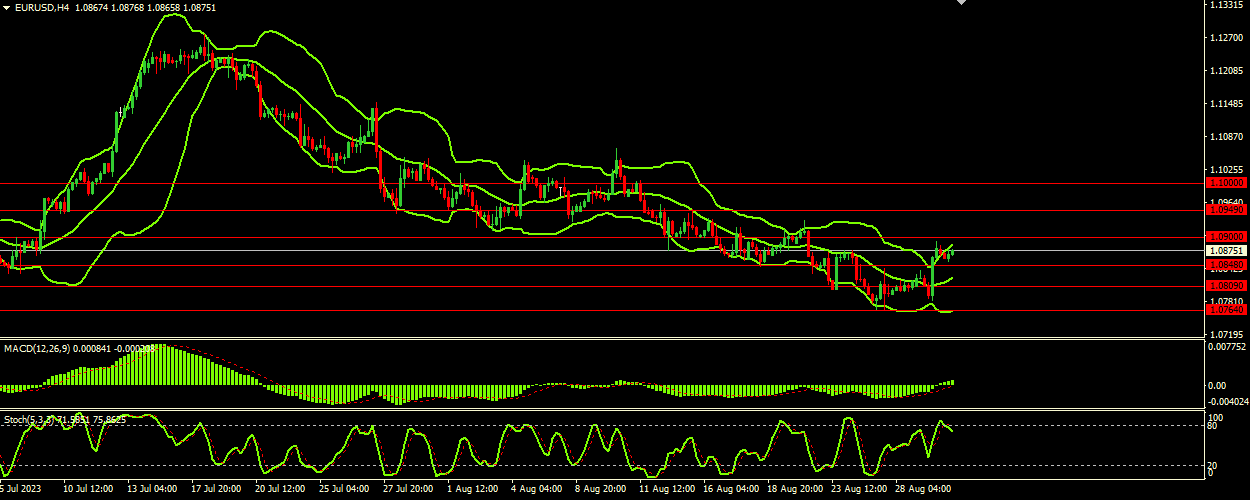
Stochastic Oscillator; The value is 75.9293 with a signal at 81.2046. This indicates a potentially overbought market. Price action is directed towards the upper band which is at 1.08800. The middle band is at 1.08190 and the lower band is at 1.07630. Price movement towards the upper band and band widening indicates increased volatility and upward trend momentum. Movement within the upper area indicates strong buying pressure. Bollinger Bands: Price action is directed towards the upper band, which is at 1.08800. The middle band is at 1.08190 and the lower band is at 1.07630. Price movement towards the upper band and band widening indicates increased volatility and upward trend momentum. Movement within the upper area indicates strong buying pressure. The MACD line (-0.000620) is below its signal line (-0.000445), indicating a potentially bearish bias in the market. However, the divergence between the two is relatively small, suggesting that the possible downside potential may be limited.
Main scenario (BUY)
Recommended entry level: 1.09000.
Take Profit: 1.09490.
Stop loss: 1.08750.
Alternative scenario (SELL)
Recommended entry level: 1.08440.
Take Profit: 1.08090.
Stop loss: 1.08750.