Technical analysis SPX500 for 06.12.2023
۰۶.۱۲.۲۰۲۳ ۰۱:۳۹
معاملات یکروزه (Intraday)
تکنیکال
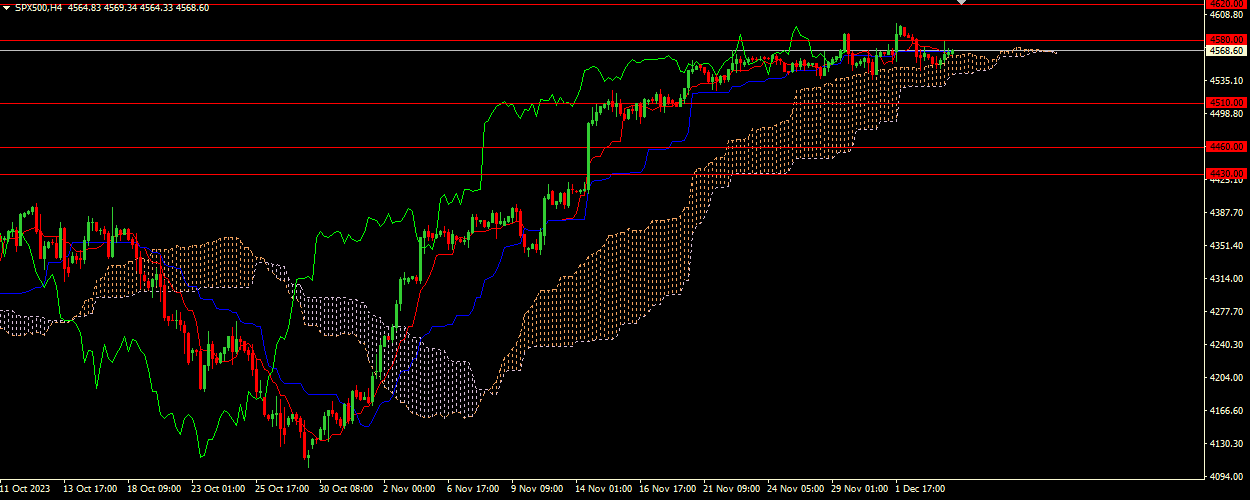
The Tenkan-sen line is located below the Kijun-sen line. Red is directed downward, while blue remains horizontal. Confirmatory line Chikou Span crosses from top to bottom the price chart. In this case, the cloud is ready to roll over from ascending to descending. Instrument is trading above the Tenkan-se and Kijun-sen lines. The closest resistance is the level 4580.00. The closest support is the level 4510.00
Key levels
- 4670.00, 4620.00, 4580.00, 4510.00, 4460.00, 4430.00
Trading scenario
- Recommended opening long positions (Buy Stop) from the level of 4580.00, with Take Profit of 4620.00 and Stop Loss of 4545.00
Alternative scenario
- Recommended opening short positions (Sell Stop) from the level of 4510.00, with Take Profit of 4460.00 and Stop Loss of 4545.00
سناریو
توصیه
BUY STOP
نقطه ورود
4580.00
حد سود (TP)
4620.00
حد ضرر
4545.00
سطوح کلیدی
4670.00, 4620.00, 4580.00, 4510.00, 4460.00, 4430.00
سناریوی جایگزین
توصیه
SELL STOP
نقطه ورود
4510.00
حد سود (TP)
4460.00
حد ضرر
4545.00