Trading Schedule Update Due to Daylight Saving Time (DST)
Please be informed that due to the transition to Daylight Saving Time (DST), the trading hours of some instruments will be temporarily adjusted from March 09th to March 27th, 2026.
Investizo LTD. Business company number 25432 BC 2019
Suite 305, Griffith Corporate Centre,
P.O. Box 1510, Beachmont, Kingstown,
St. Vincent and the Grenadines
DUNS 817053497
Phone:+996312610515
E-mail: [email protected]
© 2019-2026 Investizo 18+ All rights reserved
Risk Warning: CFDs are complex financial products traded on margin. Trading CFDs is risky and may not be suitable for all investors. Ensure you understand the risks involved as you may lose all your invested capital.
Please be informed that due to the transition to Daylight Saving Time (DST), the trading hours of some instruments will be temporarily adjusted from March 09th to March 27th, 2026.
Please note that due to the Presidents’ Day holiday in the United States on February 16, the trading schedule for several instruments will be temporarily adjusted.
With the New Year just around the corner, we would like to thank you for your trust and partnership with Investizo.
Please be informed that due to the Christmas and New Year holidays, the trading hours of some instruments will be adjusted.
Please note that due to the Thanksgiving holiday in the United States on November 27–28, 2025, the trading schedule for several instruments will be temporarily adjusted.
Please note that on the night of October 25–26, 2025, European countries will switch to winter time.
Please note the changes in the trading schedule due to the Labor Day holiday in the USA.
Please note that there are changes in the trading schedule due to the Independence Day celebrations in the United States.
Today, Investizo celebrates its 6th anniversary — years of growth, achievements, and the support of traders from around the world.
We are pleased to announce that Investizo LTD has been awarded Best ECN Broker Vietnam 2025 by the prestigious International Business Magazine Awards.
We would like to inform you about an adjustment to the opening time of the XAUUSD trading session due to changes from our liquidity provider.
We are excited to announce that Investizo has been awarded the Best Copy Trading Platform South East Asia 2025 by World Business Outlook.
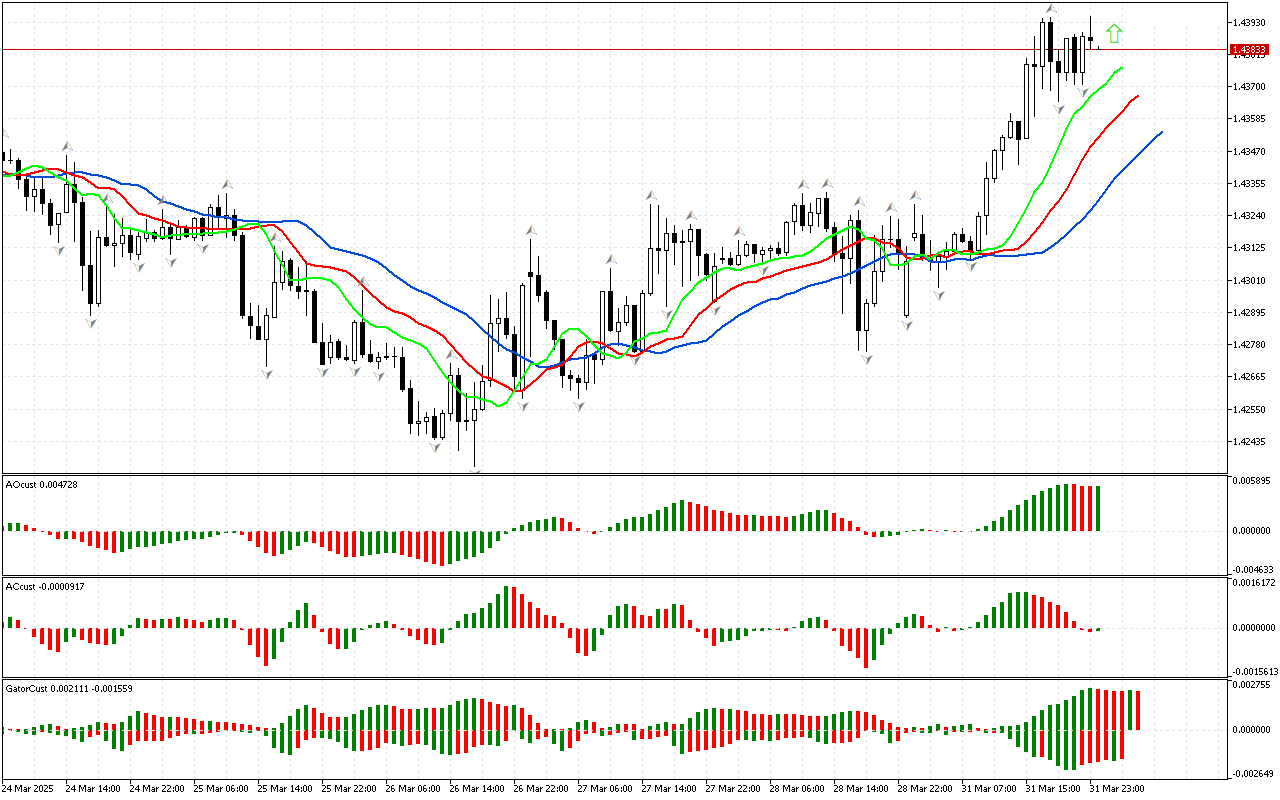
According to USDCAD, the phase space is defined as northern, since the price has risen above the upper fractal. Now we can examine signals from other market dimensions within the...
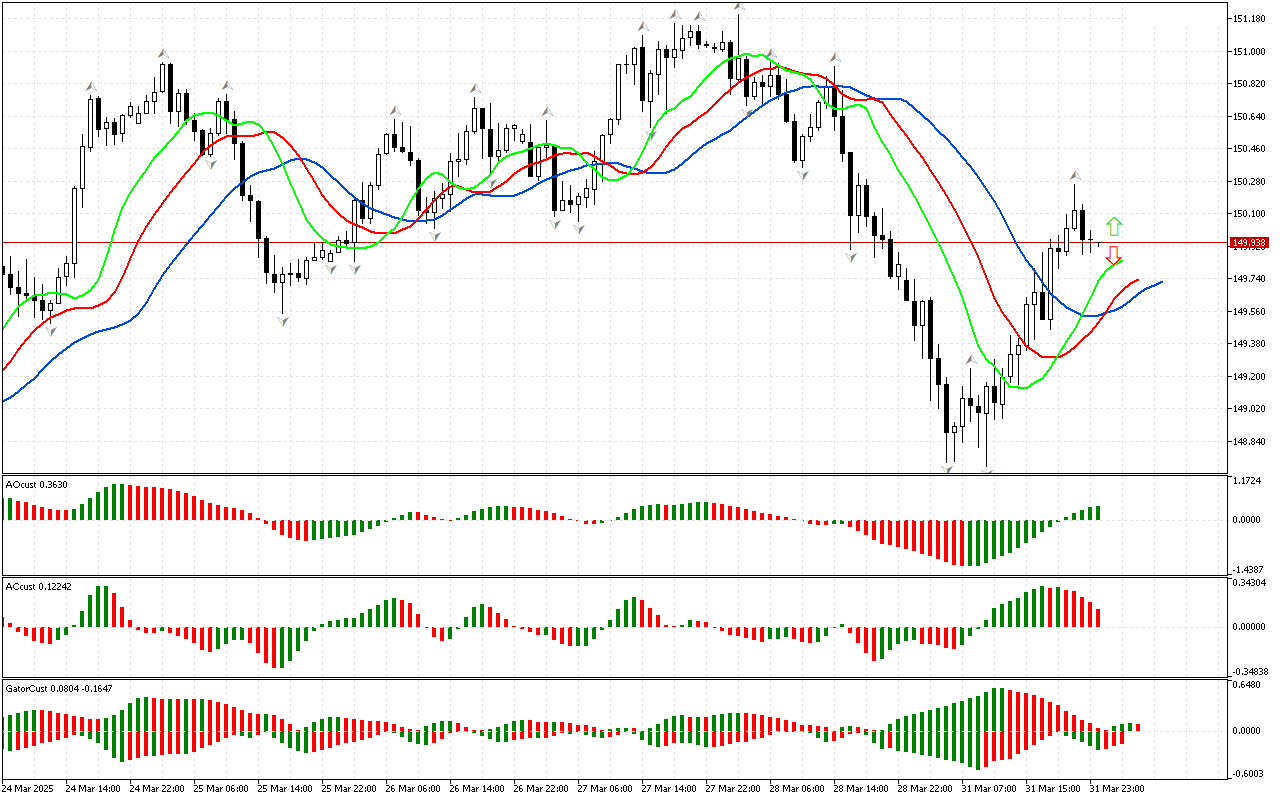
The market situation regarding USDJPY is not defined. The price did not fall below and did not rise above any of the fractals. Therefore, the signals from other indicators should...
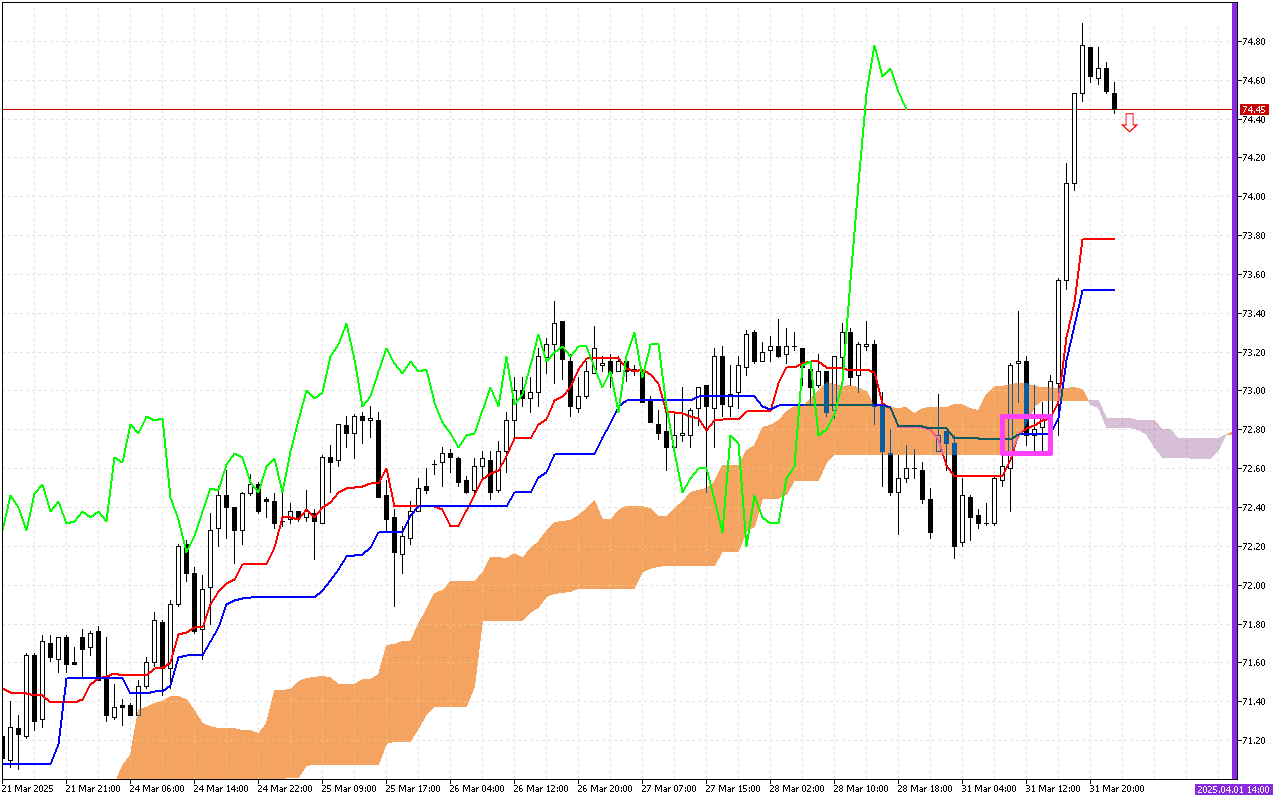
One of the main signals of previous trading sessions was the intersection of the Tenkan and Kijun lines. This area is marked with a pink square on the graph. The...